

Integrating Satellite-Derived Observations with User-Contributed Data for Delineation of Bee Forage Resources
Paper presented at the 77th International Astronautical Congress(IAC 2026), Antalya, Türkiye, 5-9 Oct 2026. Paper code:IAC-26,B1,IP,12,x108880. Poster: view the IAC 2026 iPoster.
Abstract
Effective apiary management requires knowledge of foraging resources during various season periods. However, knowledge about nectar and pollen availability depends strongly on beekeeper’s experience about locally available melliferous resources, which are temporally constrained, and geographically fragmented. This study proposes a hybrid data integration framework that combines satellite-derived Earth observation (EO) data with structured user-contributed information from beekeepers to improve the delineation and characterization of bee forage areas. Satellite imagery from Sentinel-2 provides multispectral data with high spatial and temporal resolution, enabling vegetation classification and phenological monitoring. Spectral indices and supervised land-cover classification algorithms are used to generate maps of potential melliferous habitats, including flowering crops, meadows, forests, and semi-natural grasslands. These layers can be additionally enriched with information on flowering period to serve as an approximation of forage availability. However, satellite-based system alone has limitations, including the maximum resolution of the images, neglecting smaller, more fragmented pollen and nectar sources. To address these limitations, the proposed system incorporates user-generated observations provided by beekeepers via a dedicated digital platform. Data inputs include flowering onset and duration, perceived nectar flow strength, honey yield attribution to dominant floral sources, and qualitative assessments of colony foraging behavior. The approach enhances spatial resolution of forage resource assessment, reduces uncertainty in melliferous area delineation, and supports decision-making in hive placement, apiary relocation planning, and risk mitigation under climate variability. Furthermore, the framework demonstrates how citizen-contributed domain expertise can support satellite-based environmental monitoring.
Keywords: Earth observation; Sentinel-1; Sentinel-2; precision apiculture; rapeseed; forage resources
Authors
Michał Lupaa, Dagmara Stasiowskaa,b*, Michał Wierzbińskib, Bartosz Kądziołkab, Sebastian Ciborb, Martyna Durdaa, Jakub Sumaraa, Kacper Pileckia, Mikołaj Nikiela
a Faculty of Space Technologies, AGH University of Krakow
b Apisense Sp. z o.o.
* Corresponding Author
Nomenclature
C(y) - nectar sugar contribution at source location y
K(d) - flight-distance kernel at distance d
λ - exponential decay length of the flight kernel
R - maximum flight range used by the kernel
P(x) - reachable forage potential at location x
GDD - growing degree days
Tmax, Tmin - daily maximum and minimum air temperature
Acronyms/Abbreviations
EO - Earth Observation
SAR - Synthetic Aperture Radar
NDVI - Normalized Difference Vegetation Index
NDYI - Normalized Difference Yellow Index
GDD - Growing Degree Days
ARiMR - Agency for Restructuring and Modernisation of Agriculture (Poland)
JRC - Joint Research Centre
EUCROPMAP - European Union Crop Type Map
FFT - Fast Fourier Transform
1. Introduction
The availability of floral resources is one of major factors affecting honeybee colony development and apiary productivity. However, for beekeepers the key question is not only whether a flowering crop occurs, but rather how much of such resource is available and accessible for a bee colony. Conventional assessment, based on field inspection and local knowledge, is limited to experienced beekeepers with stationary apiaries or regularly visiting the same locations, is difficult to scale over large regions and often fails to reconstruct historical conditions.
Earth observation provides a complementary source of spatial and temporal information. Sentinel-2 provides multispectral observations suitable for vegetation monitoring, while Sentinel-1 supplies weather-independent C-band radar measurements [1,2]. Their combination has demonstrated strong potential for large-area crop classification [3].
Rapeseed (Brassica napus L.) is a particularly suitable target due to its seasonal development producing distinctive optical and radar signals. Its flowering phase can be additionally detected using spectral information, providing an opportunity to connect crop occurrence with forage availability.
Spatial accessibility is another factor of consideration. Honeybee foraging distance varies with season and resource conditions; Couvillon et al. [5] reported a mean spring foraging distance of approximately 493 m from more than 5,000 waggle dances. This provides an empirical basis for replacing simple fixed-radius buffers with distance-weighted forage models.
The objective of this study is to develop an end-to-end EO workflow that transforms satellite observations into a spatially explicit rapeseed forage-resource product. The specific objectives are to: (i) detect rapeseed using Sentinel-1 and Sentinel-2 time series; (ii) assess spatial and temporal transferability; (iii) estimate flowering timing using satellite-derived phenology and temperature; and (iv) transform detected crop area into an accessibility-weighted estimate of potential nectar sugar around hive locations. The resulting EO product forms the basis for subsequent integration with beekeeper-contributed observations.
2. Material and methods
2.1. Study area and data
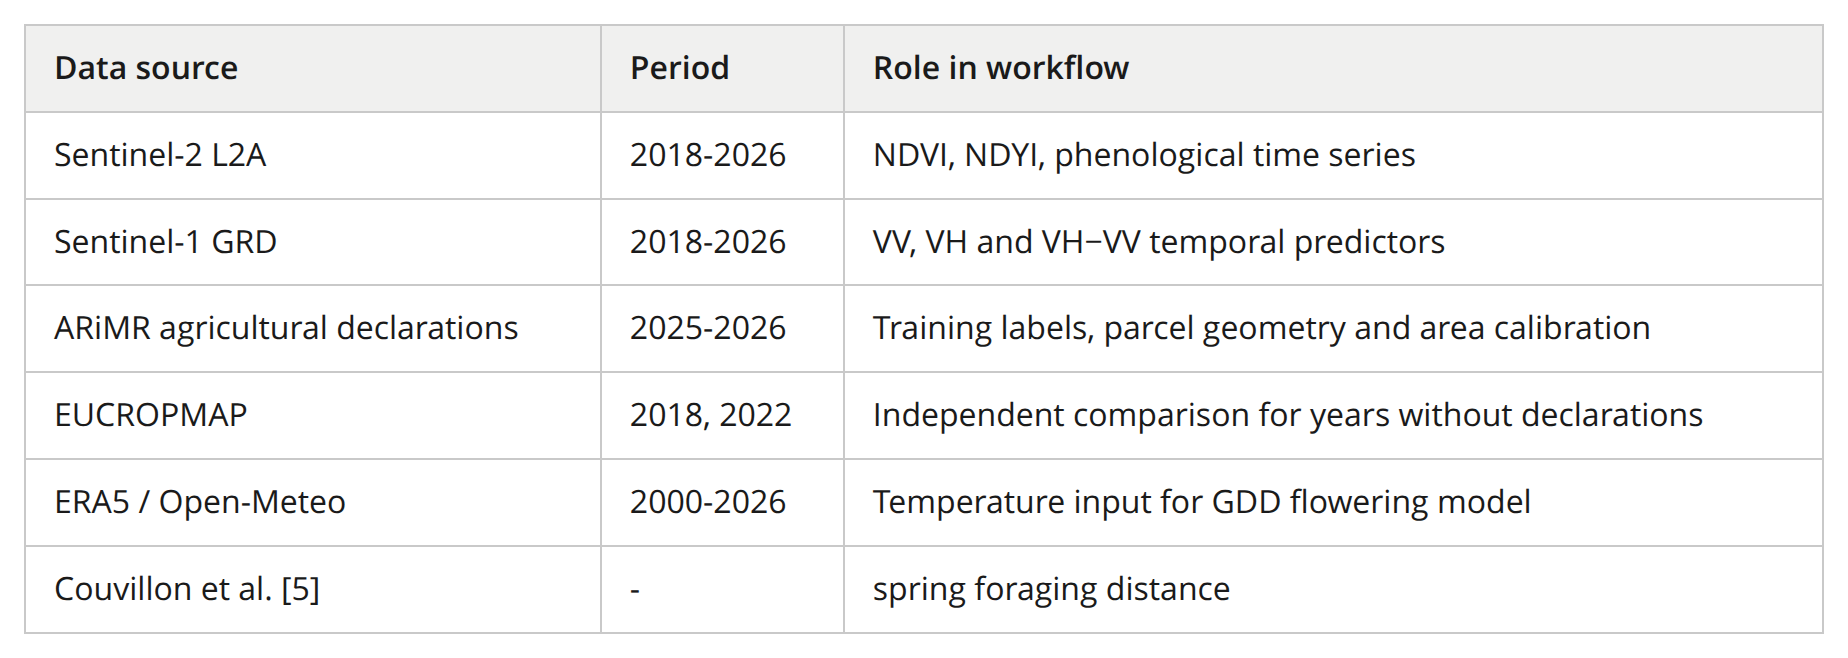
The study was conducted in the Lubelskie Voivodeship in eastern Poland, an agriculturally intensive region containing extensive winter-rapeseed cultivation. The principal regional analysis used 2022 data, as agricultural declarations for this year were not provided to the workflow, allowing the final forage map to be generated from satellite observations.
Sentinel-2 Level-2A data were used to derive NDVI and NDYI time series, while Sentinel-1 Ground Range Detected data provided VV, VH and VH−VV predictors. The classification system used observations from 2018-2026. Agricultural declarations from 2025-2026 provided training labels and parcel geometries. EUCROPMAP products for 2018 and 2022 were used as independent spatial references. ERA5 temperature data accessed through Open-Meteo were used for phenological modelling. Bee flight-distance parameters were based on Couvillon et al. [5].
2.2. Rapeseed classification
The classifier used phenological information rather than individual satellite acquisitions. The September-to-September period was divided into 26 half-month windows. For each window, NDVI and NDYI were calculated from Sentinel-2 data and expressed as scene anomalies relative to the median value of arable land. Sentinel-1 VV, VH and VH−VV backscatter values were used as radar predictors. The resulting feature vector contained 122 predictors.
A 300-tree Random Forest classifier was trained using labelled agricultural parcels. A 12-class formulation was used, with rapeseed as the target class and other crops represented explicitly rather than as a single heterogeneous background [4].
Spatial block validation was applied to reduce spatial leakage. The study area was divided into 2.5 km blocks, with complete blocks assigned to the test set. A second experiment used 10 km blocks to assess sensitivity to spatial separation.
2.3. Area calibration and temporal transfer
Because the training data were class-balanced, raw classified area could not directly represent the regional crop distribution. A multiplicative coefficient was derived from 2025: the model detected 160,321 ha compared with 150,649 ha in declarations, giving a coefficient of 0.940.
This coefficient was transferred to 2022 and compared with EUCROPMAP 2022 for total area and spatial distribution.
2.4. Flowering detection and phenology model
Flowering timing was derived from Sentinel-2 NDYI. For each area-season combination, observations around the seasonal maximum were fitted with a quadratic function and the vertex was used as peak flowering date.
A temperature model then accumulated growing degree days from 15 March using a base temperature of 1.5 °C; flowering was predicted at 430 GDD. Parameters were calibrated over 145 area-season observations from 19 spatial areas and nine seasons and evaluated using leave-one-out cross-validation.
2.5. Flight-distance kernel and forage accessibility
Detected rapeseed was converted into a spatial forage surface using:
K(d) = exp(−d/λ), d ≤ R; K(d) = 0, d > R (1)
For spring rapeseed, λ = 294 m was calibrated from the reported 493 m mean spring foraging distance. The maximum range was R = 4λ = 1178 m.
The normalized kernel was convolved with the nectar-sugar source layer:
P(x) = Σᵧ C(y) K(d(x,y)) (2)
where C(y) is the nectar-sugar contribution at the source and d(x,y) is source-target distance. The regional product used a 100 m grid and FFT-based convolution.
3. Theory and calculation
3.1 Bee-centred forage accessibility
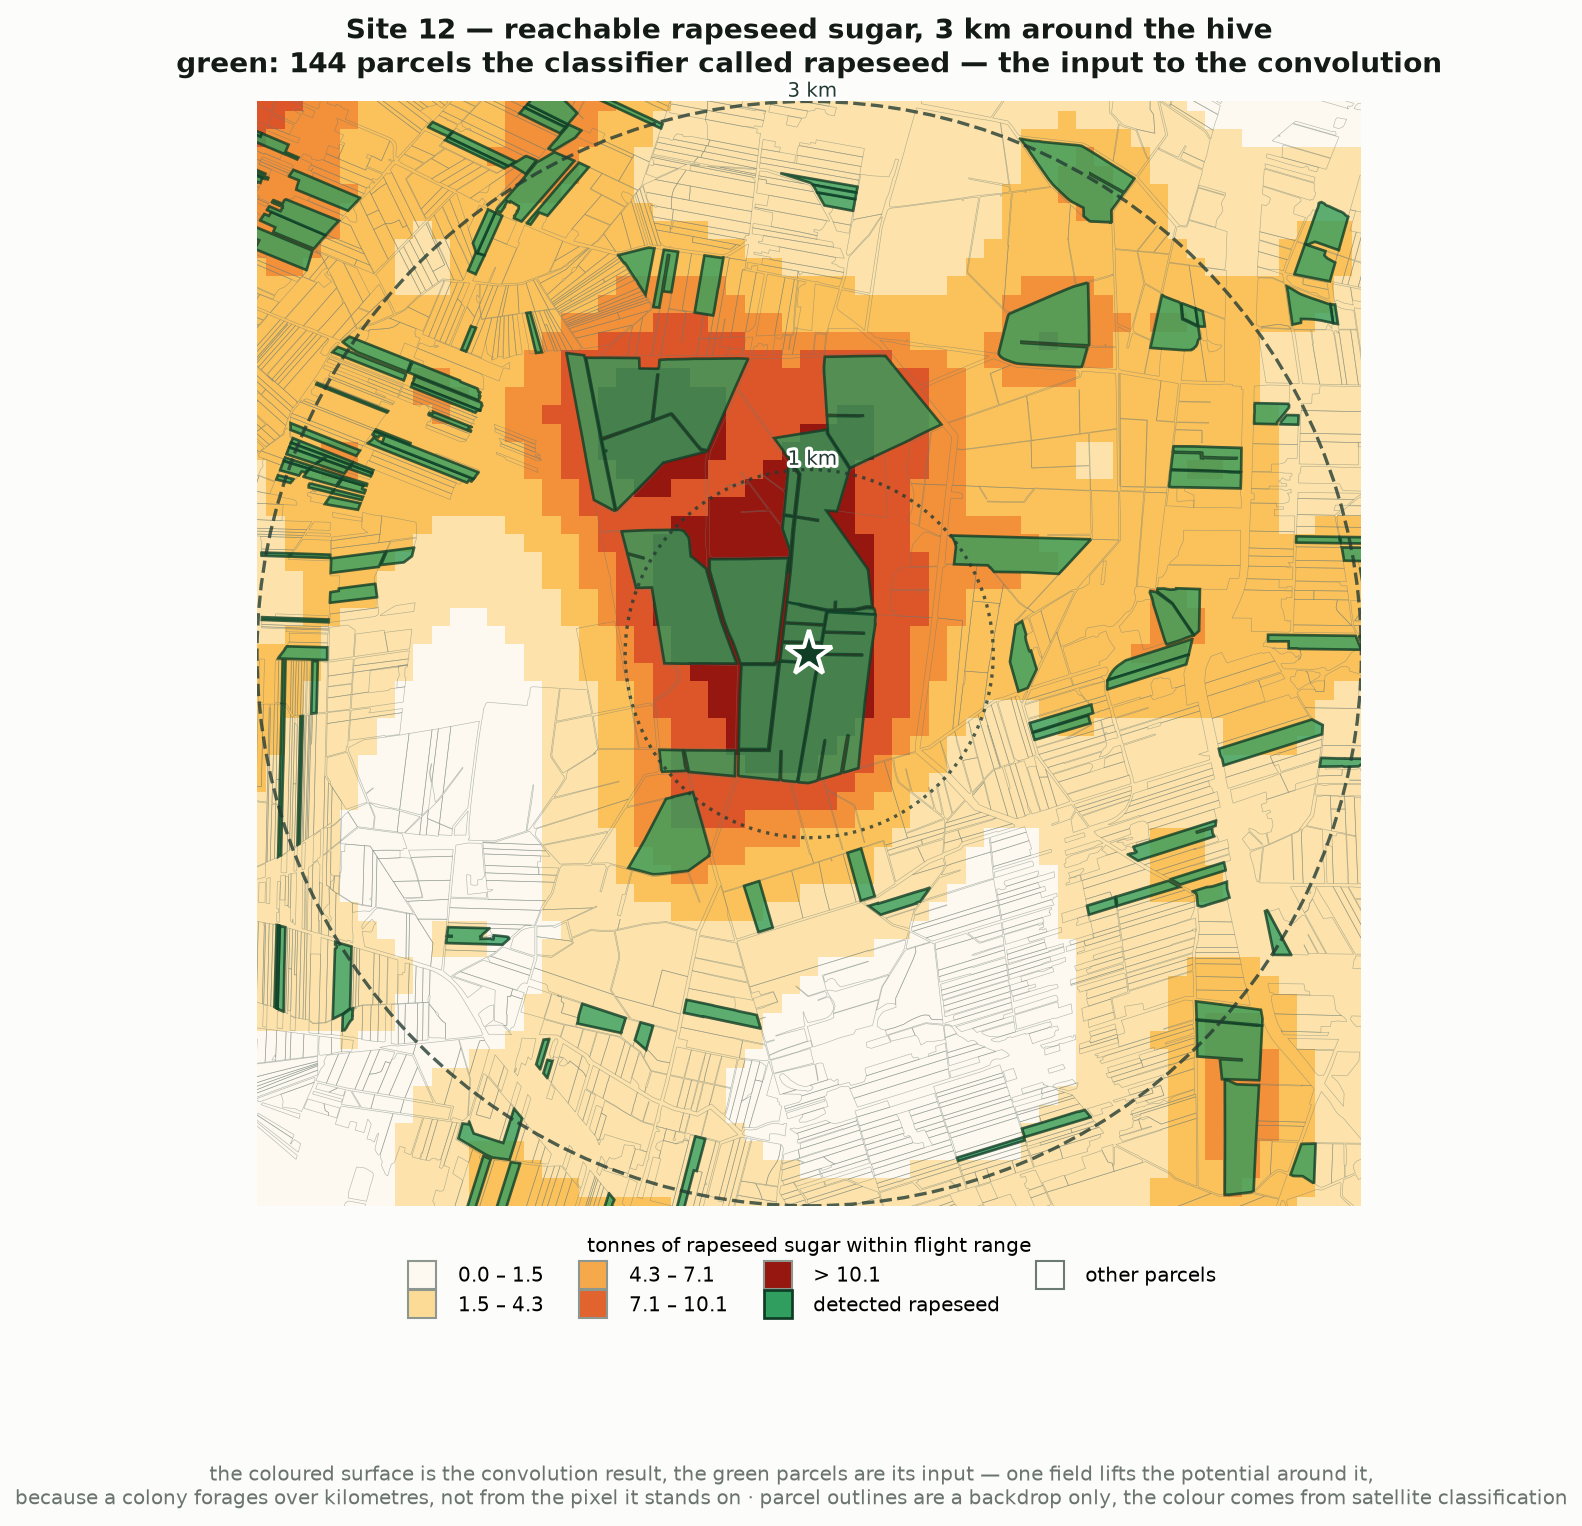
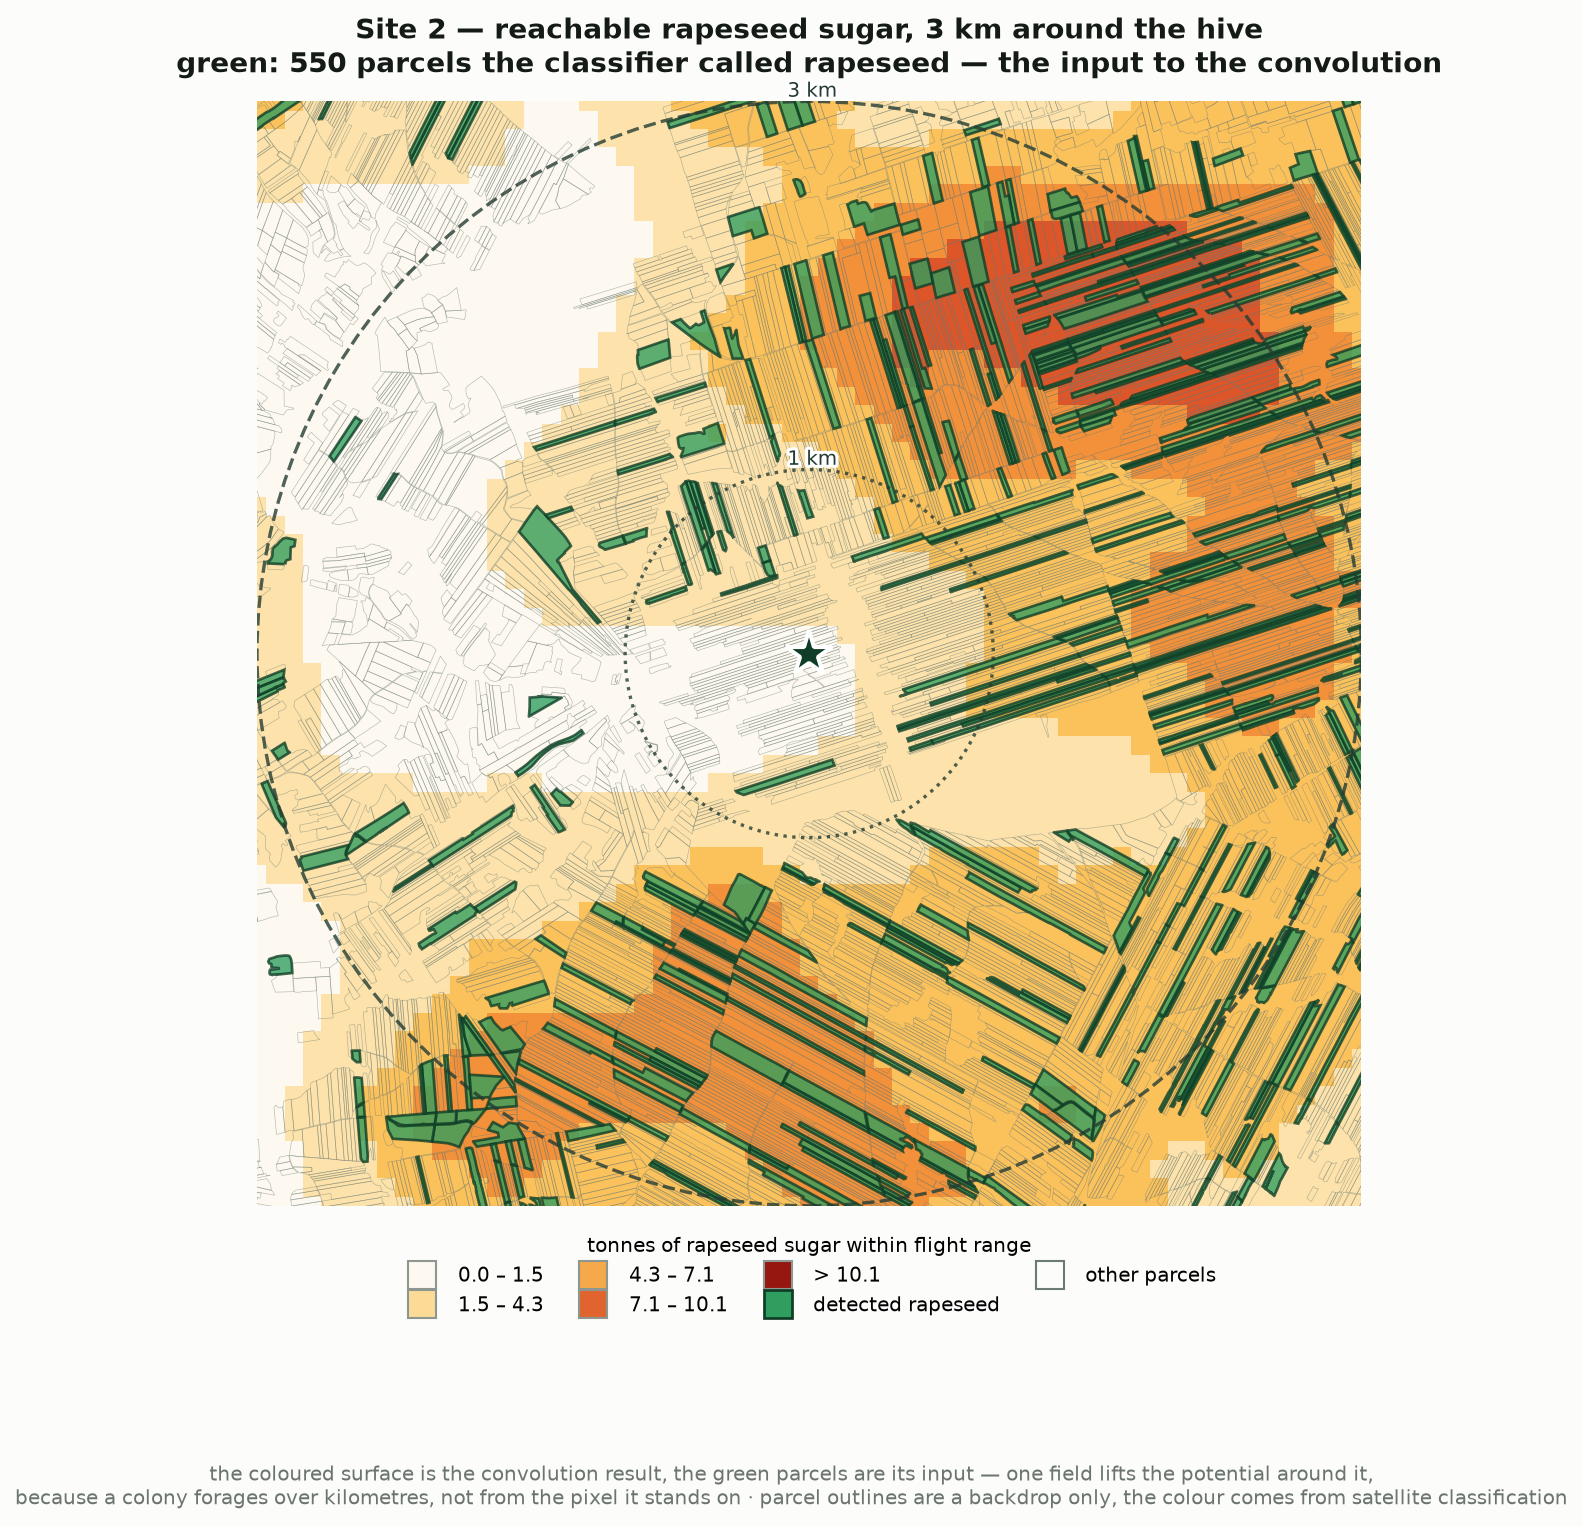
A crop map describes where rapeseed occurs but not how strongly individual fields contribute to a hive. The forage product therefore treats each detected field as a source whose contribution decreases with distance. This avoids the discontinuity of a fixed-radius buffer and anchors the spatial scale to observed honeybee behaviour.
3.2 Flowering prediction
Flowering development was represented using:
GDD(t) = Στ max[((Tmax(τ)+Tmin(τ))/2) − Tb, 0] (3)
where Tb is the base temperature and accumulation begins on 15 March. Flowering was predicted when GDD reached 430.
4. Results
4.1. Rapeseed classification performance
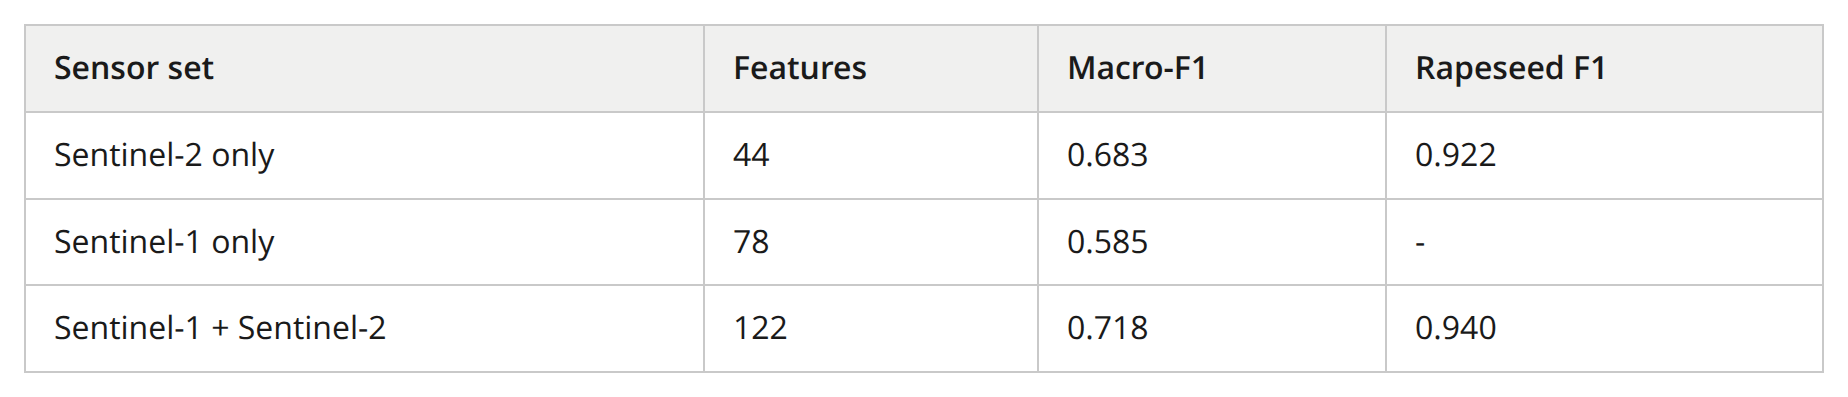
Combining Sentinel-1 and Sentinel-2 information produced the strongest classification performance. Under the 2.5 km spatial block validation, the 122-feature model achieved a macro-F1 of 0.718 and a rapeseed F1 of 0.940. Sentinel-2 alone achieved a rapeseed F1 of 0.922, while the combined model increased the macro-F1 from 0.683 to 0.718. Radar predictors accounted for 52.9% of feature importance and were particularly valuable during periods when cloud-free optical observations were unavailable.
Pixel-level evaluation revealed an important distinction between classification of representative parcel points and full-resolution deployment. At representative parcel locations, precision and recall were 0.938 and 0.942, respectively. Under real-world class proportions, pixel-level precision decreased to 0.528 while recall remained 0.872. This degradation was concentrated near parcel boundaries: the F1 score was 0.762 within 0-10 m of a field boundary, 0.917 at 10-20 m, 0.975 at 20-40 m and 1.000 beyond 40 m.
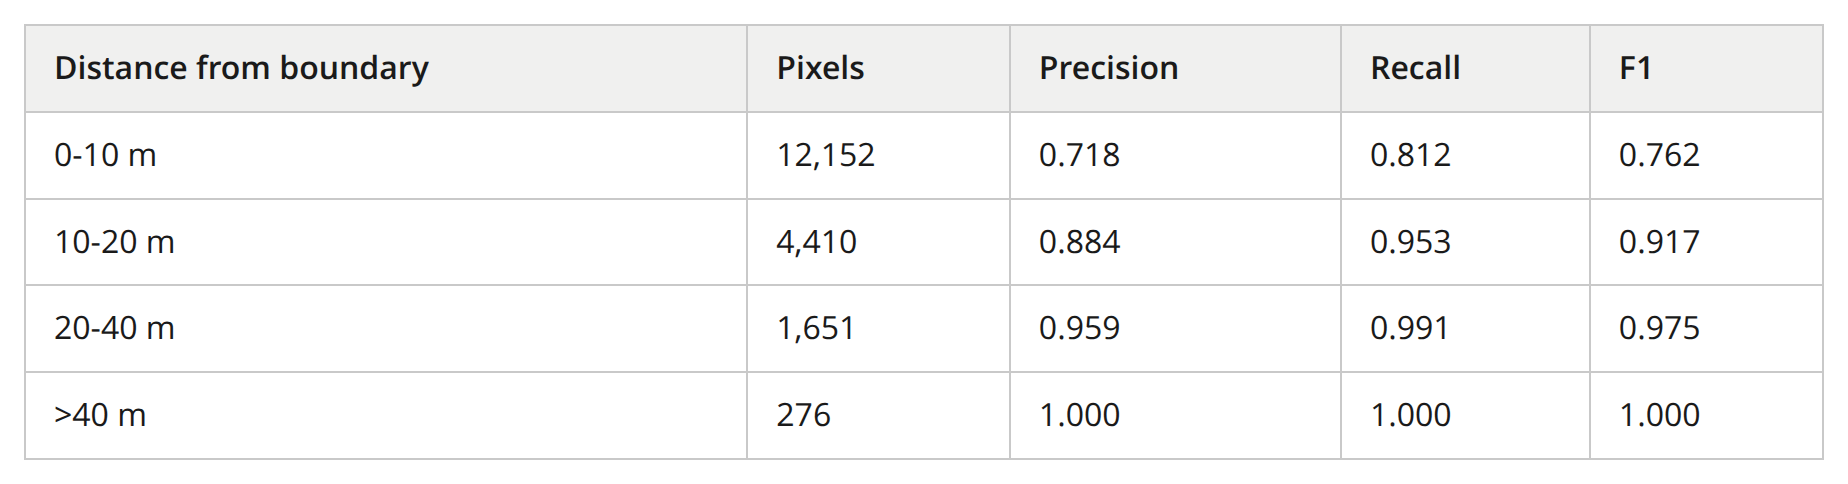
These results indicate that a 10 m pixel located on a field boundary may contain more than one land-cover condition. For a forage product intended for kilometre-scale bee movement, the resulting uncertainty is less consequential after spatial aggregation than it would be for parcel-level cadastral mapping.
4.2. Transfer to an independent season
The classifier was trained using 2025 labelled parcels and then evaluated on a separate 2026 season containing 21,933 labelled parcels. The rapeseed F1 decreased from 0.940 under the spatial validation of the training season to 0.875 on the unseen year. This reduction demonstrates a real temporal domain shift but also indicates that most of the classification signal transfers between seasons.
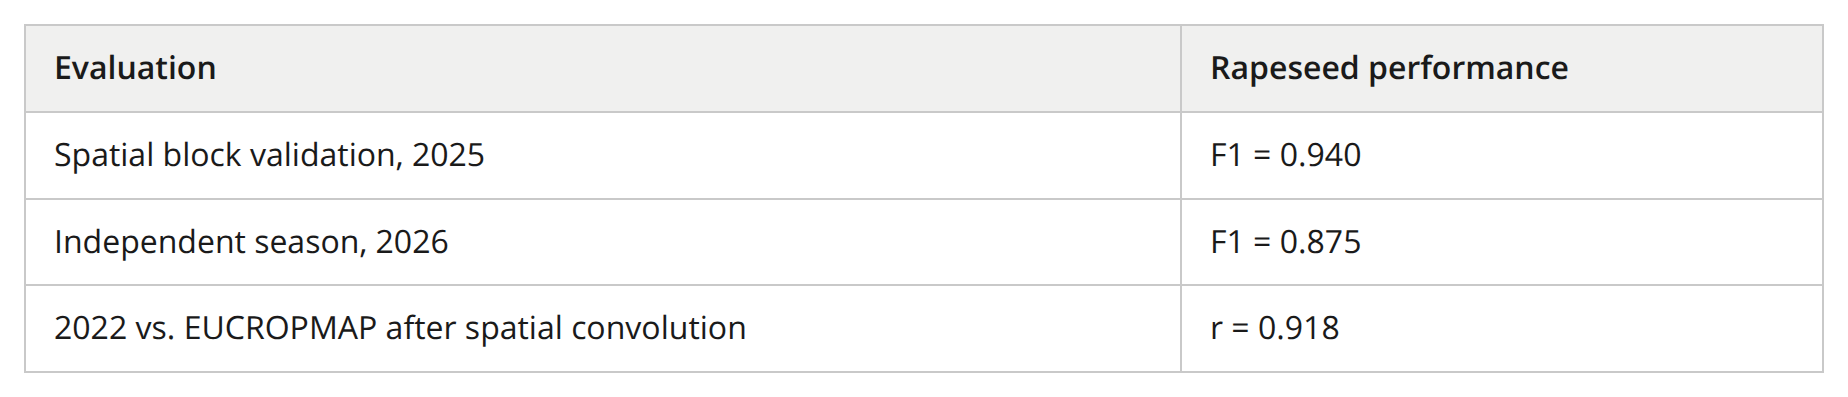
At regional scale, the 2022 calibrated estimate was 138,518 ha, compared with 147,701 ha in EUCROPMAP 2022, corresponding to −6.2%. The independent EUCROPMAP comparison is not treated as a ground-truth measurement; it is another model-based product. Nevertheless, its agreement provides evidence that the satellite-only workflow preserves the broad spatial structure of rapeseed distribution in a year without declarations.

4.3 Flowering-date estimation
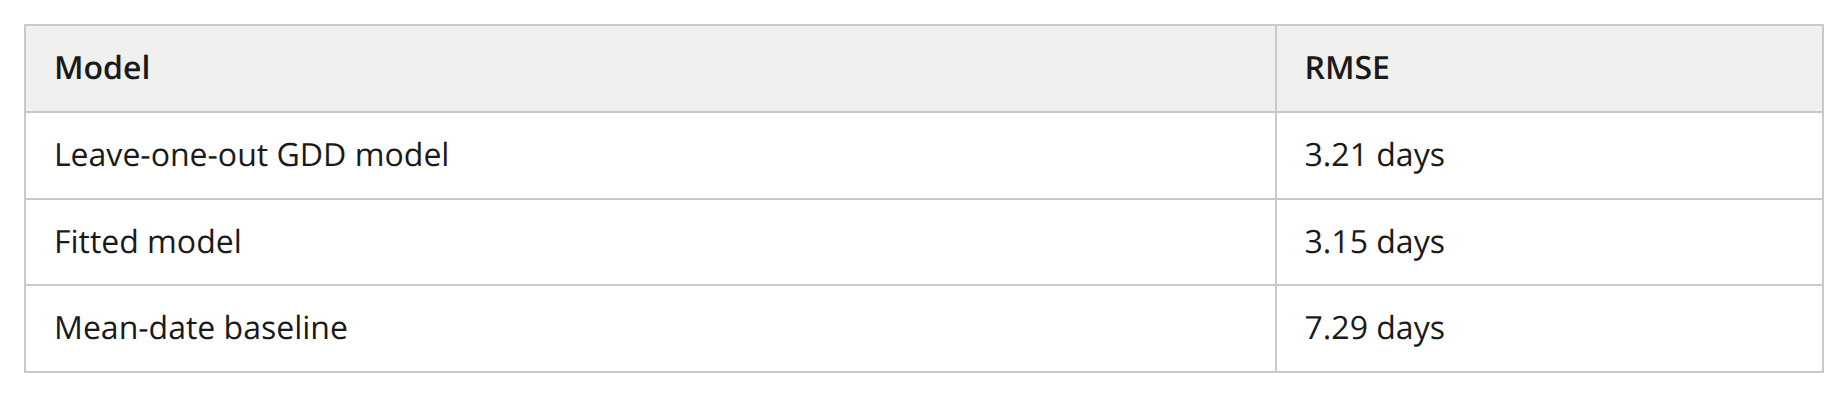
The calibrated GDD model achieved a leave-one-out RMSE of 3.21 days across 145 area-season observations. The fitted-model RMSE was 3.15 days, compared with 7.29 days for a mean-date baseline.
The estimated flowering window was approximately 23 days. Its duration varied more strongly between seasons than the uncertainty of the peak flowering date.
4.4 Flight-range modelling
The spring kernel used λ = 294 m and a maximum range of 1,178 m. Gaussian and linear alternatives correlated with the exponential result at 0.9984 and 0.9965, respectively, and reproduced 95.3% and 93.2% of the highest-potential 10% locations.
5. Discussion
The results demonstrate that Sentinel-1 and Sentinel-2 time series provide a transferable basis for rapeseed detection. The decrease from F1 = 0.940 in spatial validation to 0.875 on an independent season indicates temporal domain shift, while retaining most of the classification signal.
The 2022 result is relevant for operational forage mapping: the workflow reconstructed regional rapeseed distribution without declarations for the target year and differed from the independent EUCROPMAP estimate by 6.2%. This represents agreement between EO-derived products rather than absolute accuracy.
The accessibility transformation changes the product from crop occurrence to hive-centred potential forage. It remains simplified because wind, terrain, landscape structure, colony strength and competition can modify actual bee movement; the result should therefore not be interpreted as deterministic bee trajectories. Additionally, the results are strictly connected with the pre-assumed foraging distance. This, depending on the specific local conditions, may be subjected to change, impacting the final accuracy of the model.
Flowering timing adds the temporal dimension missing from a static crop map. The 3.21-day error indicates useful predictive performance, while the larger variation in flowering-window duration shows that predicting the availability period remains more difficult than estimating its peak.
The final nectar-sugar product has not been directly validated against measured nectar collection or honey production, and the flight kernel represents population-level rather than colony-specific movement. Future beekeeper observations of flowering onset, nectar-flow intensity and colony behaviour could provide an independent observation stream for calibrating EO-derived potential forage against realized resource use.
6. Conclusions
This study demonstrates an EO workflow for transforming satellite-derived rapeseed detection into a spatially explicit bee-forage product. Combined Sentinel-1 and Sentinel-2 observations achieved a rapeseed F1 of 0.940 under spatial validation and 0.875 on an independent season. For 2022, the calibrated estimate of 138,518 ha differed from EUCROPMAP by −6.2%, while the resulting spatial forage distributions correlated at r = 0.918. Satellite phenology combined with thermal modelling provided flowering-date estimates with a 3.21-day leave-one-out RMSE. Distance-weighted convolution transformed crop occurrence into a bee-centred accessibility surface.
The framework provides a scalable EO basis for precision apiculture and historical forage assessment. Independent validation using beekeeper and colony observations remains the key step toward estimating realized rather than potential forage use.
Acknowledgements
The authors acknowledge the Copernicus Sentinel programme for the Earth observation data used in this study, the Joint Research Centre of the European Commission for EUCROPMAP products, and the Polish agricultural and meteorological data providers used for model development and validation.
References
[1] M. Drusch, U. Del Bello, S. Carlier, O. Colin, V. Fernandez, B. Hoersch, C. Isola, P. Laberinti, A. Meygret, F. Spoto, O. Sy, F. Marchese, P. Bargellini, Sentinel-2: ESA’s Optical High-Resolution Mission for GMES Operational Services, Remote Sensing of Environment 120 (2012) 25-36.
[2] R. Torres, P. Snoeij, D. Geudtner, D. Bibby, M. Davidson, E. Attema, P. Potin, B. Rommen, N. Floury, M. Brown, I. Navas Traver, D. Duesmann, B. Rosich, N. Miranda, C. Bruno, M. L’abbate, R. Croci, A. Pietropaolo, M. Huchler, F. Rostan, GMES Sentinel-1 mission, Remote Sensing of Environment 120 (2012) 9-24.
[3] B. Ghassemi, E. Izquierdo-Verdiguier, A. Verhegghen, G. Yordanov, G. Lemoine, A. Moreno Martínez, D. De Marchi, M. van der Velde, F. Vuolo, R. d’Andrimont, European Union crop map 2022: Earth observation’s 10-meter dive into Europe’s crop tapestry, Scientific Data 11 (2024) 1048.
[4] L. Breiman, Random Forests, Machine Learning 45 (2001) 5-32.
[5] M.J. Couvillon, R. Schürch, F.L.W. Ratnieks, Waggle Dance Distances as Integrative Indicators of Seasonal Foraging Challenges, PLOS ONE 9 (2014) e93495.