
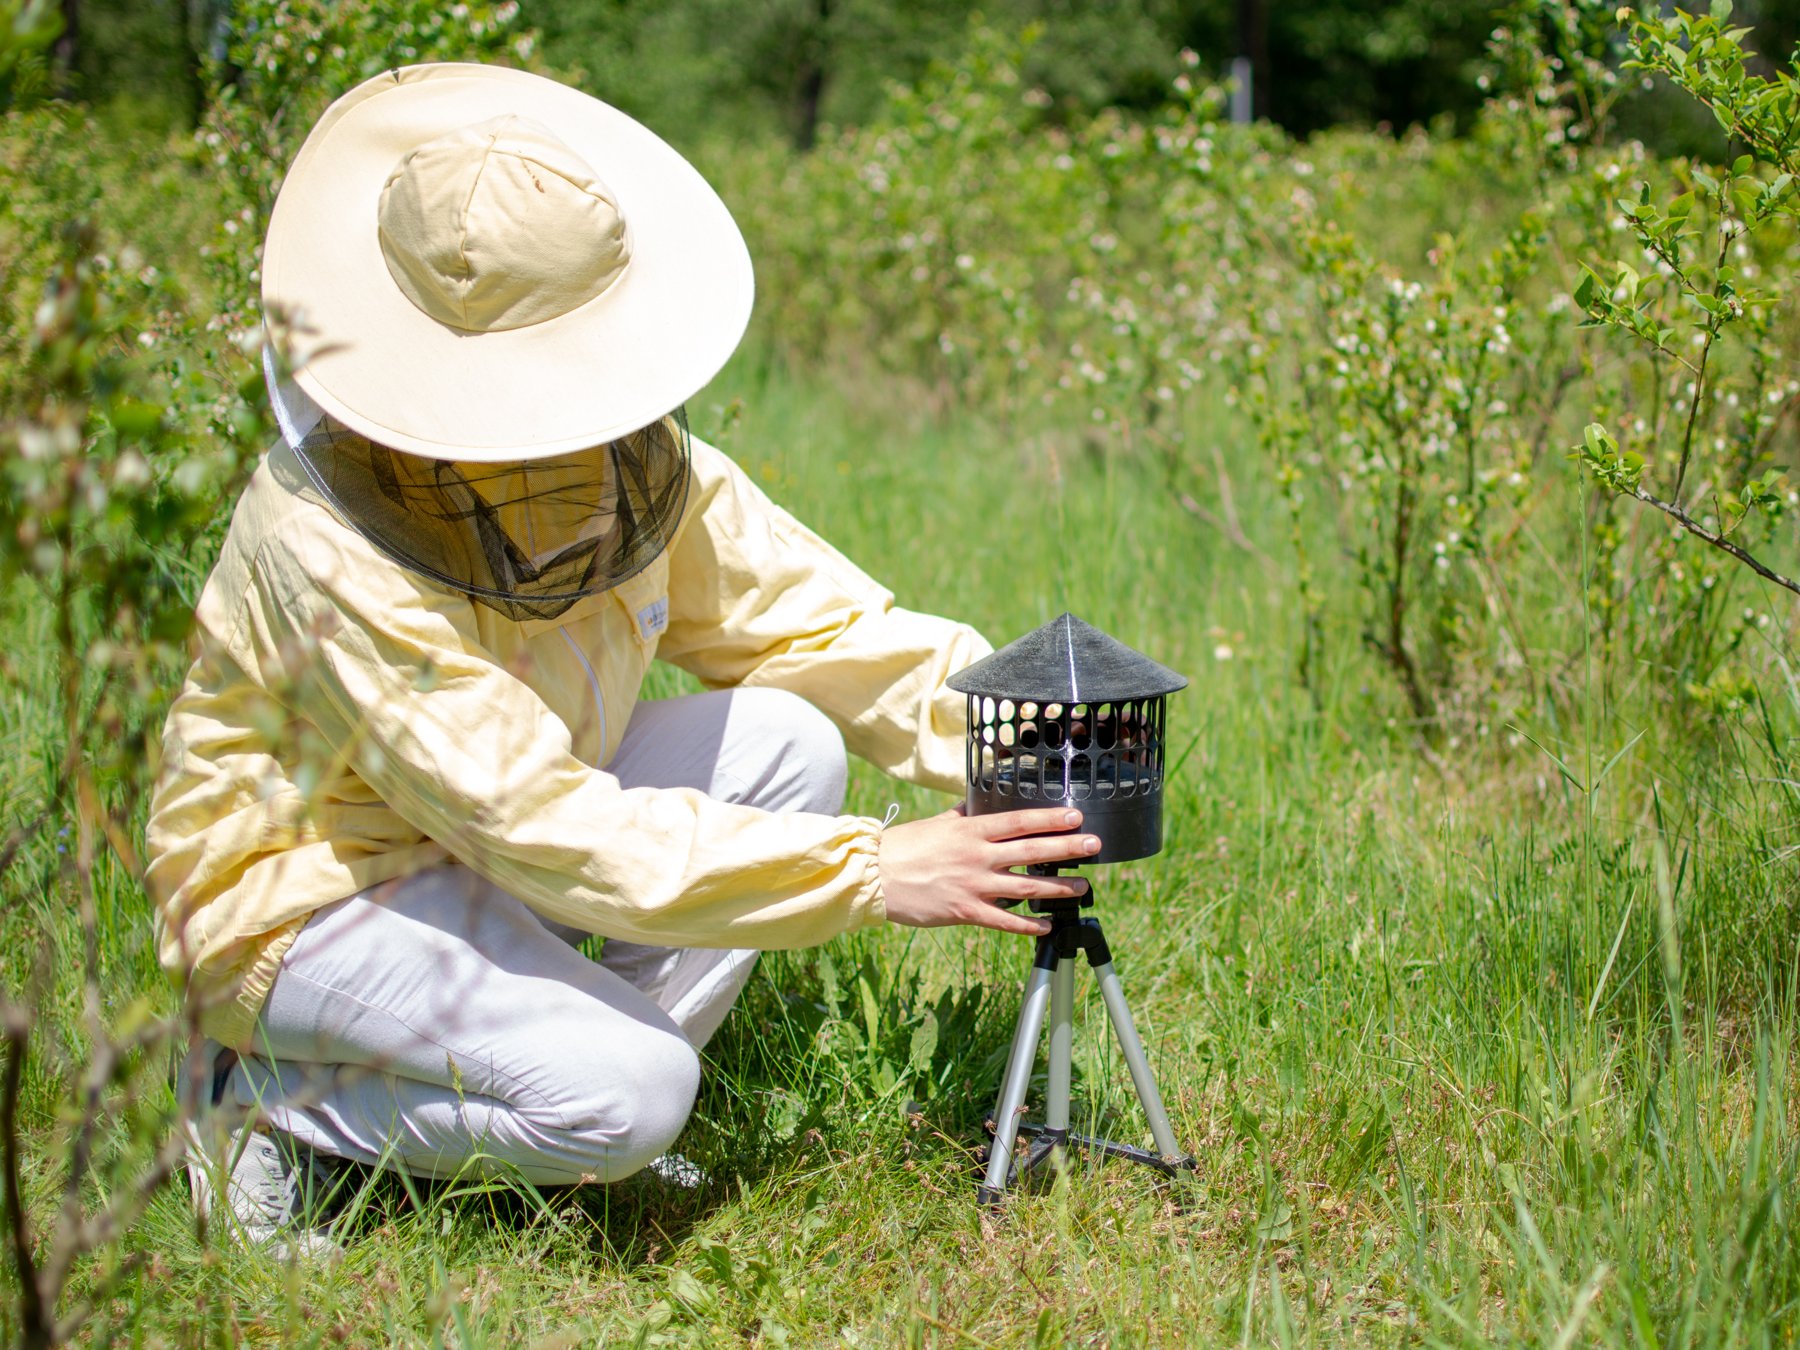
BioSonar pilot: monitoring pollination in a blueberry field
BioSonar is a small acoustic camera that listens to the insects flying around it. During nine days of blueberry bloom, 13 prototypes heard pollinator flight through the noise of a working farm, separated honeybee flight from the rest, and showed which side of the field it came from. The method works. In 2027 it goes to full-size farms.
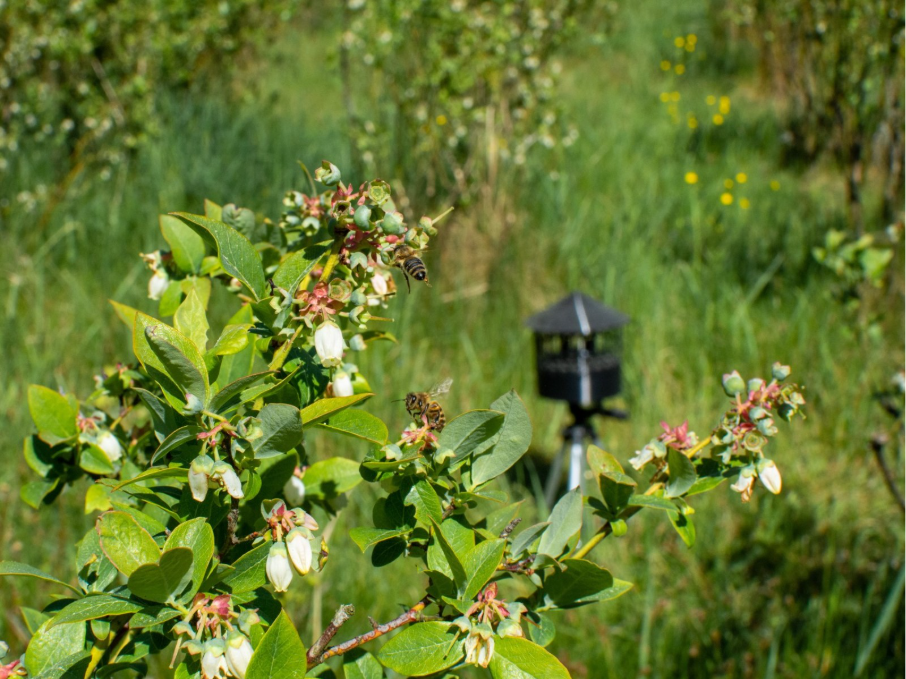
Honeybees on blueberry flowers. The BioSonar prototype stands behind them, out of focus.
Ask a blueberry grower how many hives to rent for the bloom, and the answer usually comes from a rule of thumb and last year's harvest. Whether the bees then work the whole field, or only the rows next to the hives, the grower finds out weeks later, when the fruit is picked. By then it is too late to change anything. About three quarters of the world's leading food crops depend at least partly on animal pollination, a service valued at USD 235 to 577 billion a year (IPBES 2016), and on most farms nobody measures it while it happens.
In May 2026 we put 13 prototype BioSonar sensors into a commercial blueberry field near Olkusz, in southern Poland, to see whether sound can show where pollinators are working while the bloom is still on. It can. The sensors heard insects flying through the noise of tractors and wind, separated honeybee flight from the rest, and drew a map of the directions it came from. That map changed from day to day, as real foraging does.
1. Why we listen instead of look
On video, a bee is a few millimetres of moving pixels, and video of a whole field is too much data to store or send. Sound is simpler. Every flying insect makes a tone with its wings. A honeybee beats its wings about 230 times per second (Clark et al. 2017). Bumblebees and hoverflies make similar tones at somewhat different pitches. Earlier studies showed that flight sounds can follow visual bee counts in a crop (Miller-Struttmann et al. 2017), and that how closely they follow flower visits depends on the plant (Hearon et al. 2025).
A BioSonar sensor is four microphones and a small computer in a weatherproof housing, set at flower height. Every 64 milliseconds it measures the pitch of the sound around it, how clean the tone is, how much energy falls in the bee band, and the direction the sound came from. The direction comes from the very small delay between the sound reaching each microphone. In controlled tests with a static source up to about 4 metres away, it was accurate to about 5 degrees on average. The least consistent unit had a spread of about 11 degrees.
All of this runs on the sensor. It sends out only these measurements, not the audio, which is about 2.3 GB per sensor over nine days instead of about 50 GB of raw four-channel audio. That is small enough for many sensors to share one farm internet connection.
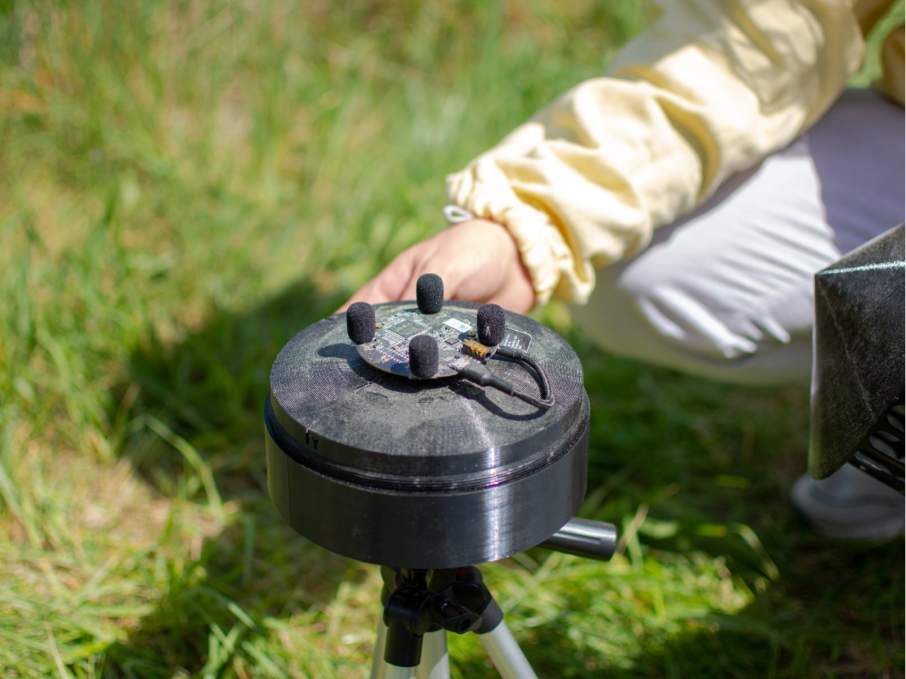
The BioSonar prototype. Four microphones on top, a small computer inside the housing.
2. From every pollinator to the honeybee
A sensor in a flowering field hears everything that flies within a few metres of it: honeybees, bumblebees, hoverflies and other insects. For this pilot we asked one clear question. Can we take the honeybees out of that mix?
We chose honeybees for a practical reason. They live in hives, and we knew where every hive stood. That gives each sensor a fixed point to check its readings against, which makes honeybees the most precise first test. We separate them in two steps.
- Sound. For every 64 ms moment, the sensor keeps only a clean tone at the pitch of a honeybee wingbeat, and drops the sound of passing vehicles and wind. Each moment that passes is one detection. Sound alone cannot fully separate species: a bumblebee or hoverfly with a similar wingbeat can also pass this filter, which is why the second step matters.
- Direction. A sensor cannot hear a hive 10 to 20 metres away, but it does hear the honeybees flying past it to and from the hive, so over a day most of the detections at a sensor should point to the hive side. Wild pollinators have no hive in the field and do not form this pattern.
One honeybee flying past gives a short run of detections. The number of detections therefore measures how much honeybee flight a sensor heard, not how many bees there were.
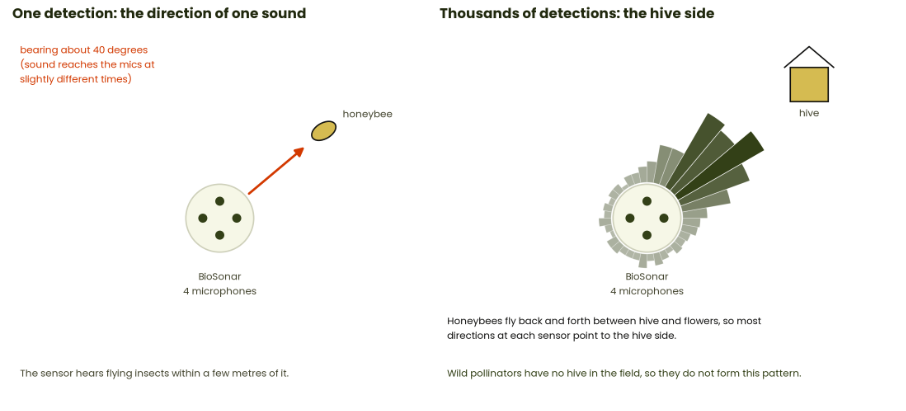
One detection gives one direction. Thousands of them, from honeybees flying to and from a hive, point to the hive side of the sensor.
3. Nine days in a blueberry field
The test field is a commercial highbush blueberry plot of about 0.11 hectares, with 16 rows and five hives at its edges. We set the 13 sensors in a dense grid in the centre-left of the field, about 2 metres apart between rows and 8 to 10 metres between columns, all facing the same way so that their directions could be compared. They recorded from 8:00 to 19:00 on nine days of bloom between 19 and 28 May.
The grid was dense on purpose. With 13 sensors on a 0.11-hectare plot, the research setup corresponded to roughly 120 sensors per hectare, far denser than a commercial installation. The first test of a method should look at every sensor up close, and a small plot does that better than a few sensors spread over many hectares. A farm layout will be much sparser, which we come back to in section 6.
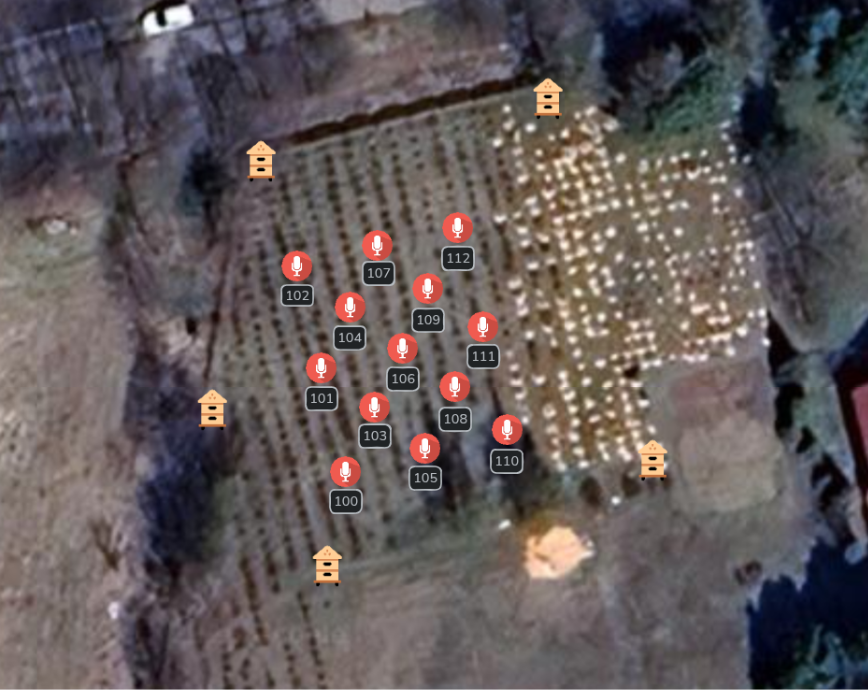
The test field from above. Red markers are the 13 sensors, the hive icons are the five hives.
It was also the first time the hardware stayed outdoors for days, next to farm machinery, and not on a test bench. All 13 sensors ran for the full nine days and passed inspection afterwards. One lost an extra day, outside the nine, to a hardware fault, and two that had been mounted at an angle were corrected in software. On day five, several sensors at once recorded twenty minutes of a low tonal hum that was almost certainly farm machinery. A test bench never produces noise like that, which is exactly why we tested in a working field. What we learned is already in the second version: a screw-mounted windshield in place of foam that came loose, a separate power supply for each sensor, and ground spikes in place of photo tripods.
4. What the sensors heard
Across the nine-day campaign, the sensors processed about 75 million acoustic frames, each one a 64 ms moment of sound. After filtering, about 61,000 of them remained as bee-flight detections, roughly 0.08% of everything the sensors heard. The rest was farm noise, wind and flight at other pitches. We then put the directions of the detections on a map of the field, one disc per sensor.
These are frames, not bees. A single pass spans many frames, so we also converted frames into estimated visits, taking 2 seconds, or 31 frames, as one visit. On that basis a sensor registered from a few up to about 35 estimated visits per hour at peak, and this per-sensor, per-hour value is what a grower would see on a dashboard. We report frames first because frames are what the device measured. Counting whole flight events directly is one of the 2027 upgrades.
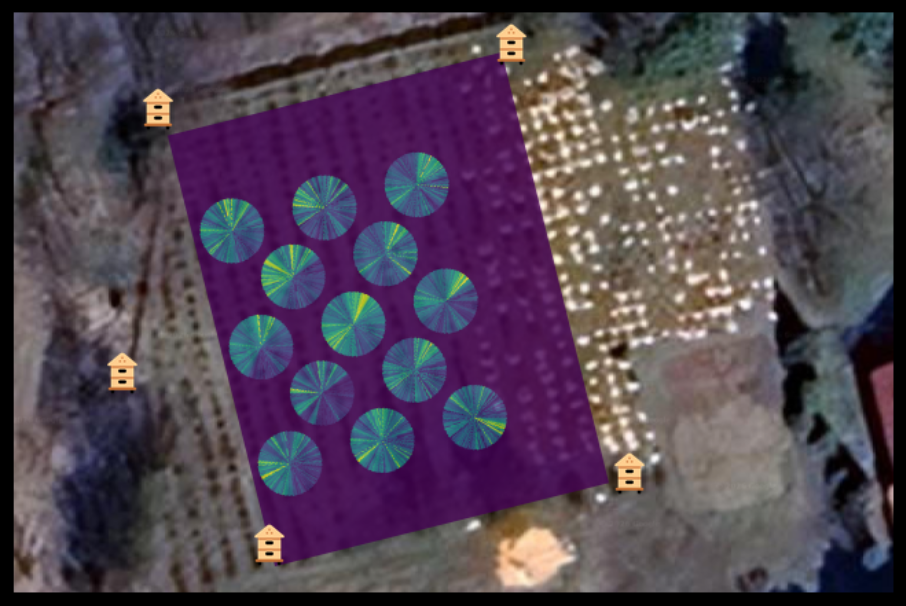
All nine days together. Each disc is one sensor, and its colours show how often sound came from each direction. Larger discs heard more. Hive positions were fitted from the field layout, not from logged coordinates.
Most directions point to the hive in the top-right corner. The bottom-right corner had the fewest directions pointing at it, and it was also the quietest part of the field.
The filter runs in four stages. It keeps frames whose pitch, tonal purity and band energy fall in the honeybee range, rejects the loud, moving signature of vehicles and the steady energy of wind, groups what remains into clusters and keeps the one that separates most cleanly, and finally checks its direction pattern. That last stage is still manual: for each sensor and day we checked that the direction pattern pointed to a hive before we accepted it, so the map confirms that the hive pattern is there. The amount of activity, which corner stayed quiet, and which hive the bees favoured on a given day all came from the recordings.
5. A different pattern every day
A fixed noise source, such as a pump or a road, would give the same pattern every day. The maps do not repeat. On day eight, for example, most directions point to the lower-left hive.
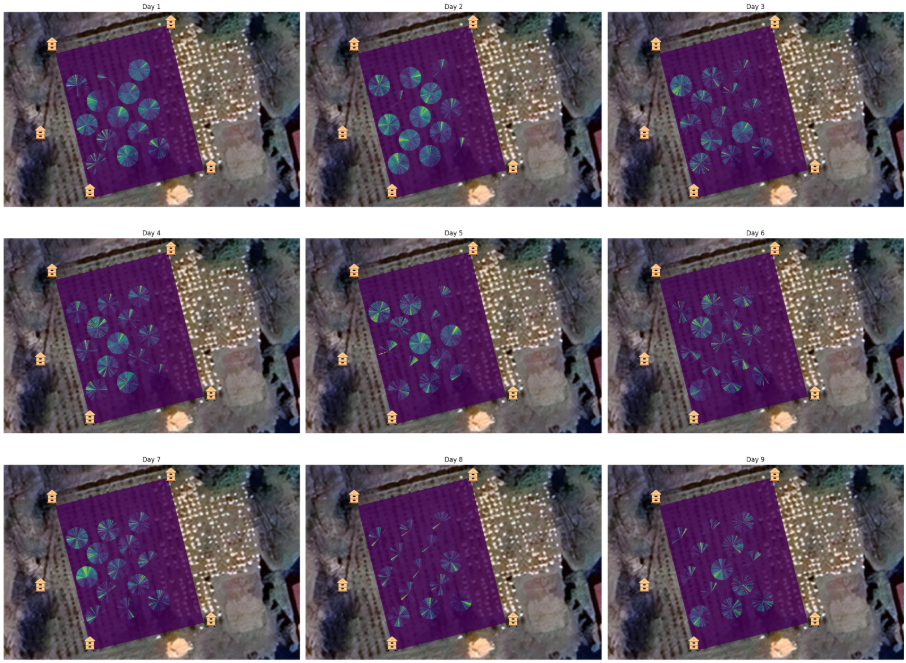
The same map, one day at a time. The side of the field the honeybees came from changes from day to day.
The amount of activity changed too. The sensors logged about 13,500 and 14,700 bee-flight detections on the first two days. Activity then dropped to a lower level, rose again for one day on day seven, and ended at about 2,200 detections on day nine. Most detections came between morning and afternoon. A grower could put a curve like this next to the flowering dates of their own field.
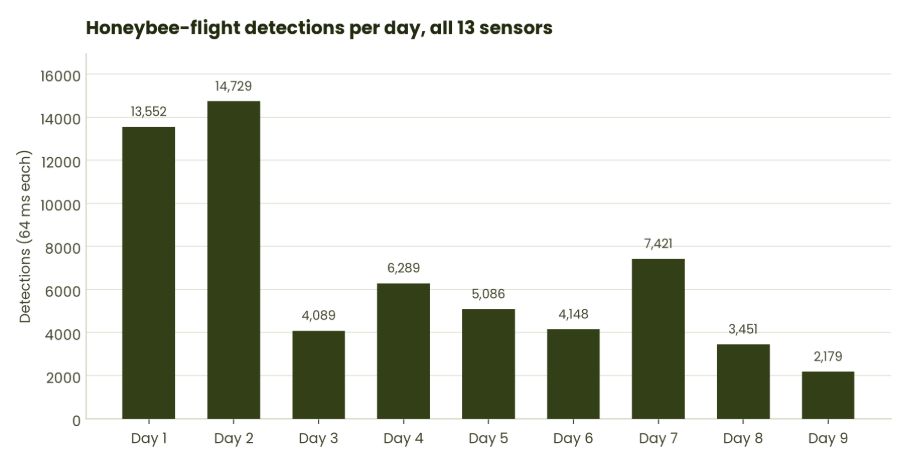
Honeybee-flight detections per day, all 13 sensors together.
6. What a grower will get
The goal is a map of how much pollinator activity each part of a field gets, and when, during bloom, while there is still time to move hives or change a plan.
A sensor hears honeybees only within a few metres, but it does not need to hear every bee. The directions of the bees that fly past show where they come from, so one sensor tells you about a larger area than it can hear. We expect one sensor per hectare, about one every 100 metres, to be enough for a commercial farm. Commercial in-field pollination sensors run at one to four per hectare.
The dense research grid lets us test how much of this information survives as sensors are spaced further apart. Because every sensor recorded its own directional activity profile, we can remove sensors from the dataset in software and simulate sparser commercial layouts before field-scale validation in 2027.
7. Where this goes
One field, nine days, 13 sensors, and the method works. The hardware ran on a working farm, the software ran for nine days without supervision, and the direction maps show clear patterns that change with the days. BioSonar will become part of our Pollination Intelligence system. The 2027 season takes it from a test plot to real farms.
- Full-size commercial plots for a full season, with sensors at farm spacing.
- Visual bee counts next to every sensor and a held-out test set, so that detection quality is measured against observation and the number of detections can be connected to real flower visits and, through them, to pollination.
- A trained classifier in place of the manual direction check.
- Counting whole flights instead of 64 ms moments.
- Separating other pollinators, such as bumblebees and hoverflies, in the same recordings.
- Logged hive and sensor coordinates, weather and bloom stage, so that each map can be tested against the conditions that produced it.
We will be back in the field in spring 2027 with the second version of BioSonar. The only open question is where. If you grow blueberries, apples, rapeseed or another crop that needs pollinators and would host a trial, or if you research pollination and want to help design the bee counts, contact us through the contact page.
Until now, a grower learned how well the bees worked only at harvest. BioSonar is built to show it during the bloom, while there is still time to act.
References
- IPBES (2016). Assessment report on pollinators, pollination and food production. https://www.ipbes.net/assessment-reports/pollinators
- Clark, Mountcastle, Mistick and Elias (2017). Resonance frequencies of honeybee wings. Journal of Experimental Biology 220:2697. https://doi.org/10.1242/jeb.154609
- Miller-Struttmann et al. (2017). Flight of the bumble bee: buzzes predict pollination services. PLOS ONE 12(6): e0179273. https://doi.org/10.1371/journal.pone.0179273
- Hearon et al. (2025). buzzdetect: deep-learning bioacoustic pollinator monitoring. Journal of Insect Science 25(6). https://pmc.ncbi.nlm.nih.gov/articles/PMC12690740/