
Our Latest Articles
BioSonar pilot: monitoring pollination in a blueberry field
1. Introduction
Ask a blueberry grower how many hives to rent for the bloom, and the answer usually comes from a rule of thumb and last year's harvest. Whether the bees then work the whole field, or only the rows next to the hives, the grower finds out weeks later, when the fruit is picked. By then it is too late to change anything. About three quarters of the world's leading food crops depend at least partly on animal pollination, a service valued at USD 235 to 577 billion a year (IPBES 2016), and on most farms nobody measures it while it happens.
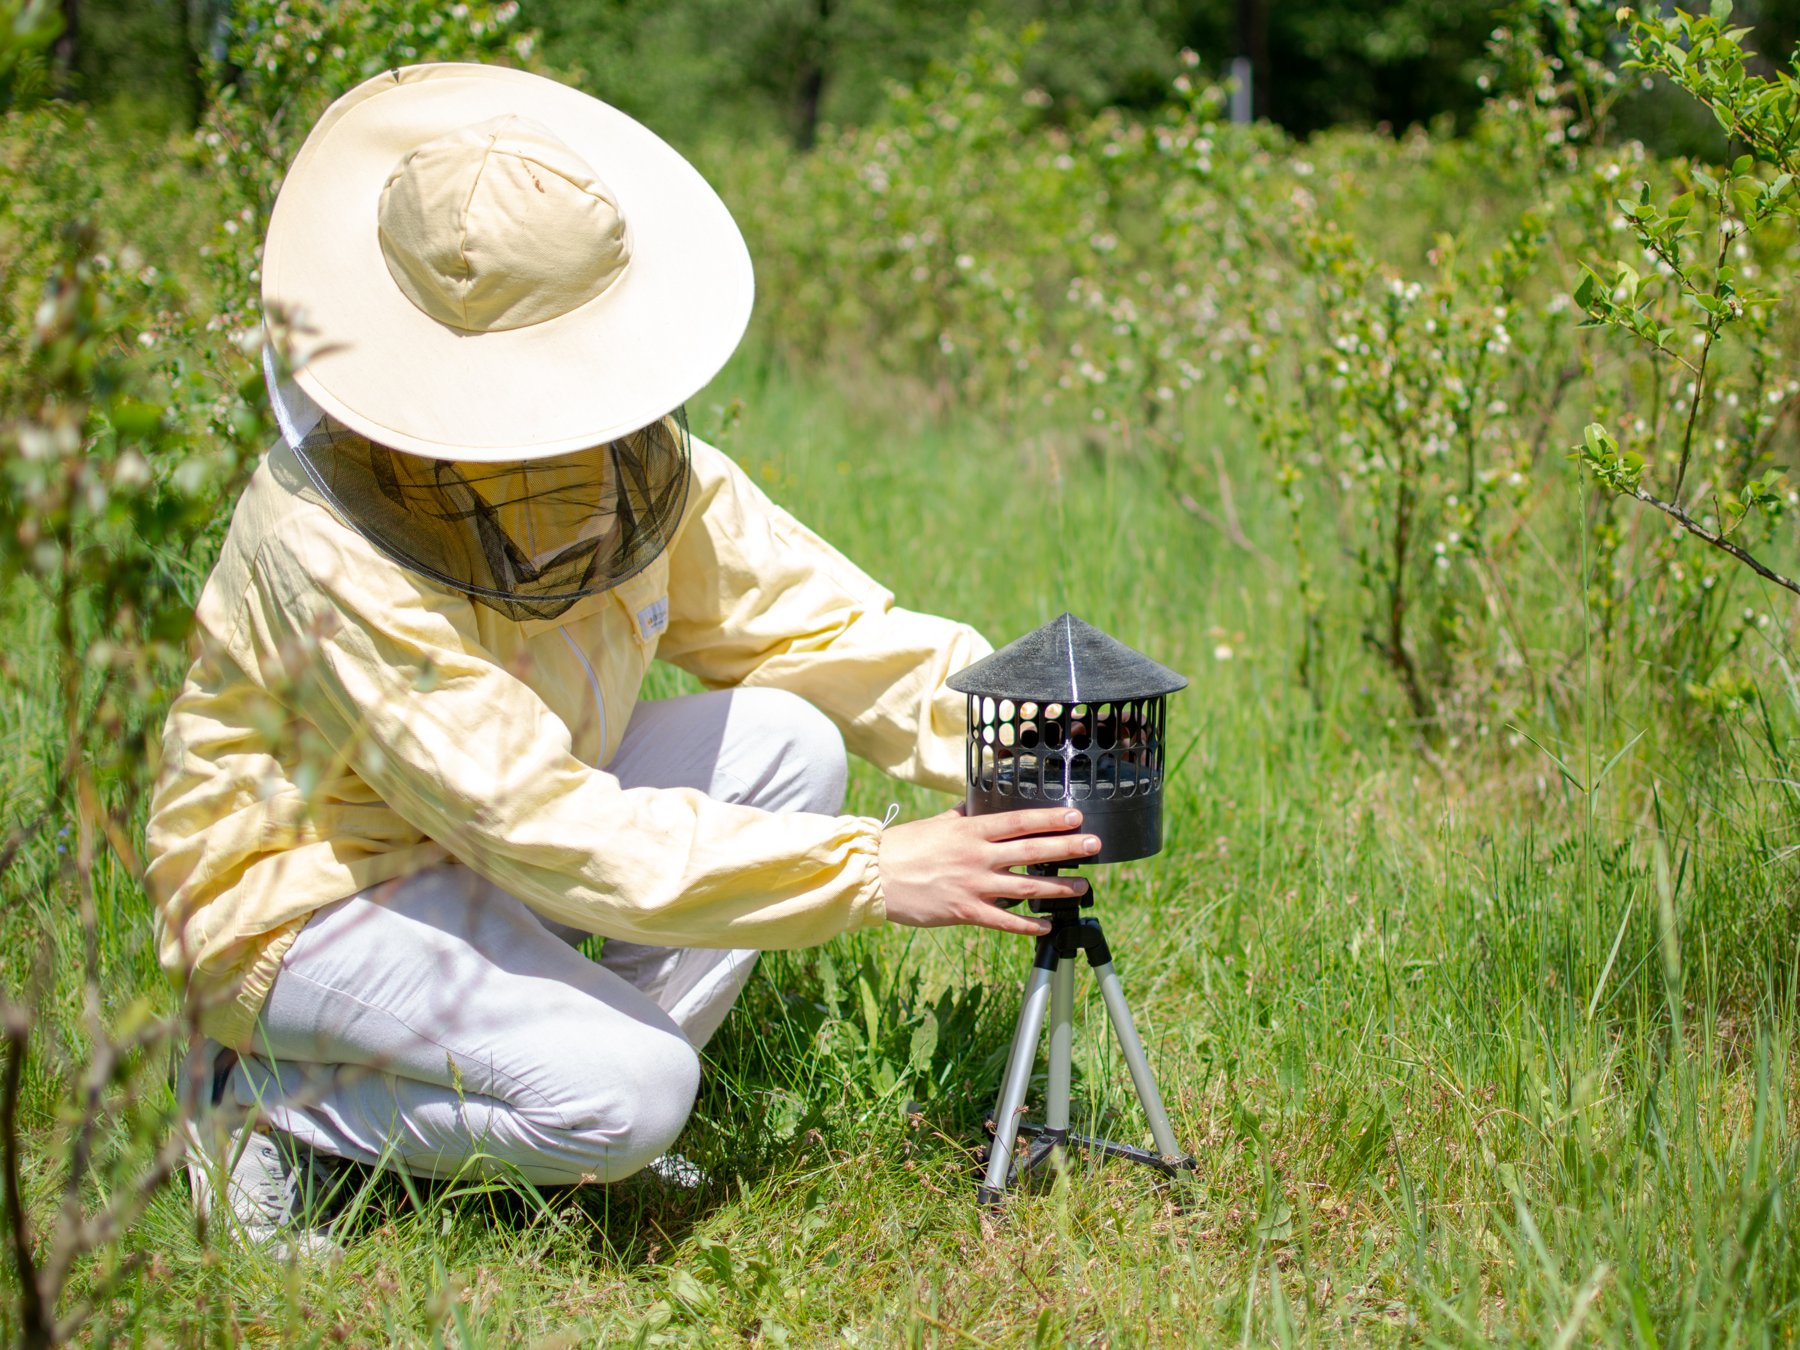
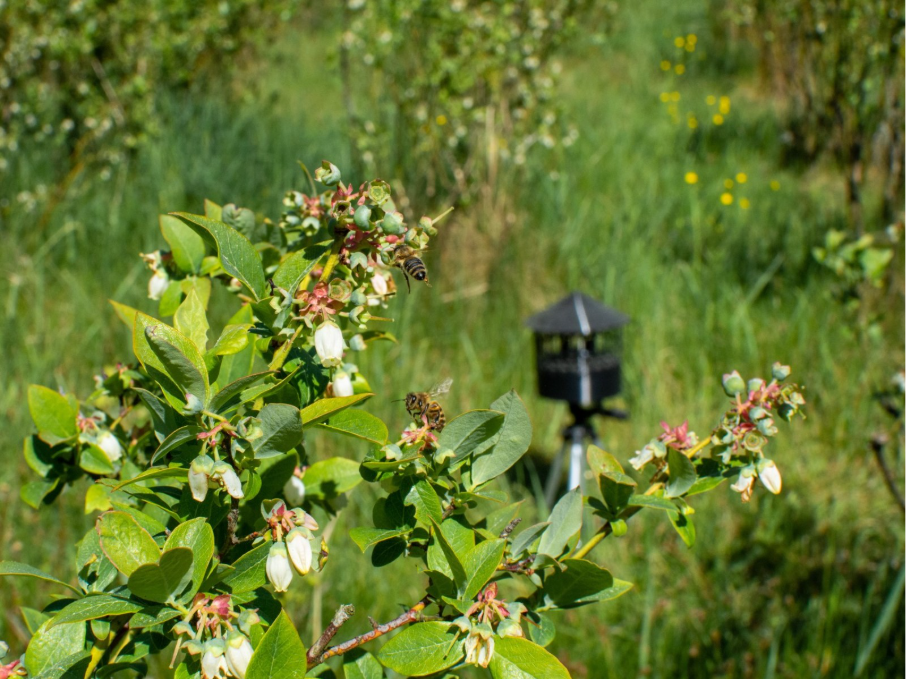
In May 2026 we put 13 prototype BioSonar acoustic cameras into a commercial blueberry field near Olkusz, in southern Poland, to see whether sound can show where pollinators are working while the bloom is still on. It can. The sensors heard insects flying through the noise of tractors and wind, separated honeybee flight from the rest, and drew a map of the directions it came from. That map changed from day to day, as real foraging does.
2. Why we listen instead of look
On video, a bee is a few millimetres of moving pixels, and video of a whole field is too much data to store or send. Sound is simpler. Every flying insect makes a tone with its wings. A honeybee beats its wings about 230 times per second (Clark et al. 2017). Bumblebees and hoverflies make similar tones at somewhat different pitches. Earlier studies showed that flight sounds can follow visual bee counts in a crop (Miller-Struttmann et al. 2017), and that how closely they follow flower visits depends on the plant (Hearon et al. 2025).
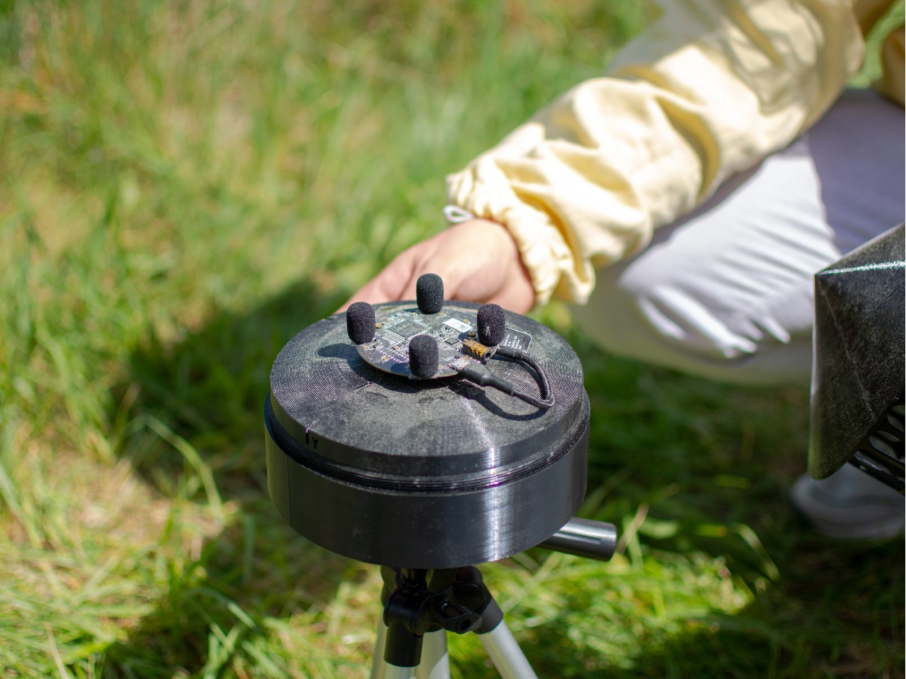
A BioSonar sensor is four microphones and a small computer in a weatherproof housing, set at flower height. Every 64 milliseconds it measures the pitch of the sound around it, how clean the tone is, how much energy falls in the bee band, and the direction the sound came from. The direction comes from the very small delay between the sound reaching each microphone. In controlled tests with a static source up to about 4 metres away, it was accurate to about 5 degrees on average. The least consistent unit had a spread of about 11 degrees.
All of this runs on the sensor. It sends out only these measurements, not the audio, which is about 2.3 GB per sensor over nine days instead of about 50 GB of raw four-channel audio. That is small enough for many sensors to share one farm internet connection.
3. From every pollinator to the honeybee
A sensor in a flowering field hears everything that flies within a few metres of it: honeybees, bumblebees, hoverflies and other insects. For this pilot we asked one clear question. Can we take the honeybees out of that mix?
We chose honeybees for a practical reason. They live in hives, and we knew where every hive stood. That gives each sensor a fixed point to check its readings against, which makes honeybees the most precise first test. We separate them in two steps.
- Sound. For every 64 ms moment, the sensor keeps only a clean tone at the pitch of a honeybee wingbeat, and drops the sound of passing vehicles and wind. Each moment that passes is one detection. Sound alone cannot fully separate species: a bumblebee or hoverfly with a similar wingbeat can also pass this filter, which is why the second step matters.
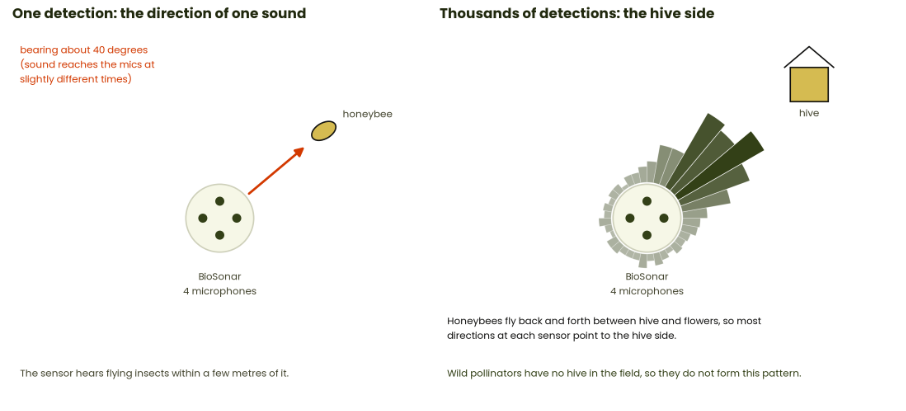
- Direction. A sensor cannot hear a hive 10 to 20 metres away, but it does hear the honeybees flying past it to and from the hive, so over a day most of the detections at a sensor should point to the hive side. Wild pollinators have no hive in the field and do not form this pattern.
One honeybee flying past gives a short run of detections. The number of detections therefore measures how much honeybee flight a sensor heard, not how many bees there were.
4. Nine days in a blueberry field
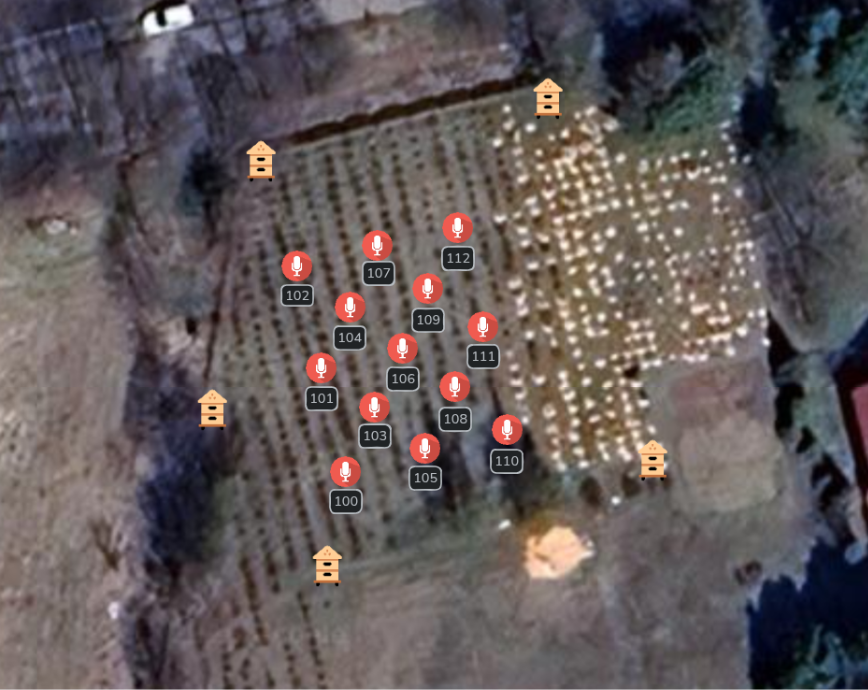
The test field is a commercial highbush blueberry plot of about 0.11 hectares, with 16 rows and five hives at its edges. We set the 13 sensors in a dense grid in the centre-left of the field, about 2 metres apart between rows and 8 to 10 metres between columns, all facing the same way so that their directions could be compared. They recorded from 8:00 to 19:00 on nine days of bloom between 19 and 28 May.
The grid was dense on purpose. With 13 sensors on a 0.11-hectare plot, the research setup corresponded to roughly 120 sensors per hectare, far denser than a commercial installation. The first test of a method should look at every sensor up close, and a small plot does that better than a few sensors spread over many hectares. A farm layout will be much sparser, which we come back to in section 6.
It was also the first time the hardware stayed outdoors for days, next to farm machinery, and not on a test bench. All 13 sensors ran for the full nine days and passed inspection afterwards. One lost an extra day, outside the nine, to a hardware fault, and two that had been mounted at an angle were corrected in software. On day five, several sensors at once recorded twenty minutes of a low tonal hum that was almost certainly farm machinery. A test bench never produces noise like that, which is exactly why we tested in a working field. What we learned is already in the second version: a screw-mounted windshield in place of foam that came loose, a separate power supply for each sensor, and ground spikes in place of photo tripods.
5. What the sensors heard
Across the nine-day campaign, the sensors processed about 75 million acoustic frames, each one a 64 ms moment of sound. After filtering, about 61,000 of them remained as bee-flight detections, roughly 0.08% of everything the sensors heard. The rest was farm noise, wind and flight at other pitches. We then put the directions of the detections on a map of the field, one disc per sensor.
These are frames, not bees. A single pass spans many frames, so we also converted frames into estimated visits, taking 2 seconds, or 31 frames, as one visit. On that basis a sensor registered from a few up to about 35 estimated visits per hour at peak, and this per-sensor, per-hour value is what a grower would see on a dashboard. We report frames first because frames are what the device measured. Counting whole flight events directly is one of the 2027 upgrades.
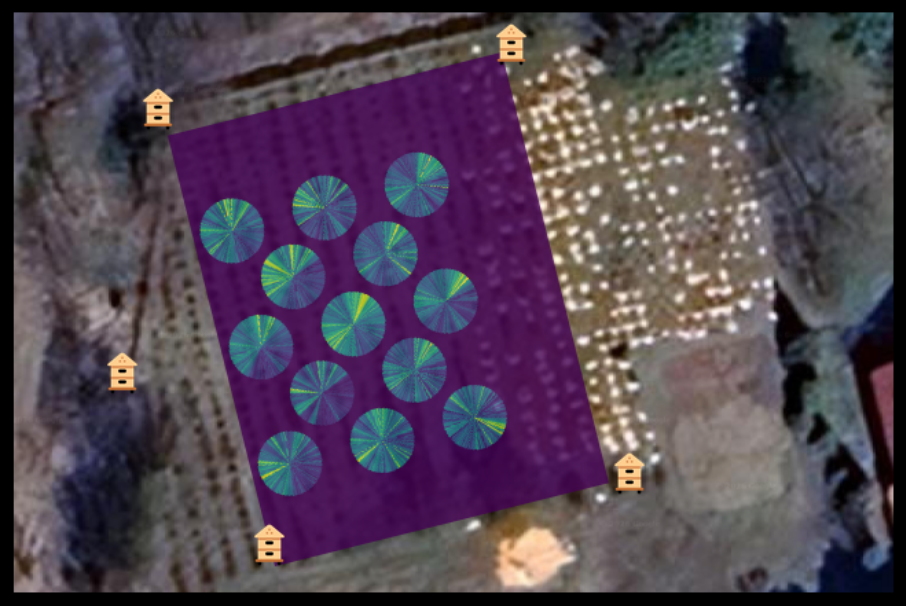
Most directions point to the hive in the top-right corner. The bottom-right corner had the fewest directions pointing at it, and it was also the quietest part of the field.
The filter runs in four stages. It keeps frames whose pitch, tonal purity and band energy fall in the honeybee range, rejects the loud, moving signature of vehicles and the steady energy of wind, groups what remains into clusters and keeps the one that separates most cleanly, and finally checks its direction pattern. That last stage is still manual: for each sensor and day we checked that the direction pattern pointed to a hive before we accepted it, so the map confirms that the hive pattern is there. The amount of activity, which corner stayed quiet, and which hive the bees favoured on a given day all came from the recordings.
6. A different pattern every day
A fixed noise source, such as a pump or a road, would give the same pattern every day. The maps do not repeat. On day eight, for example, most directions point to the lower-left hive.
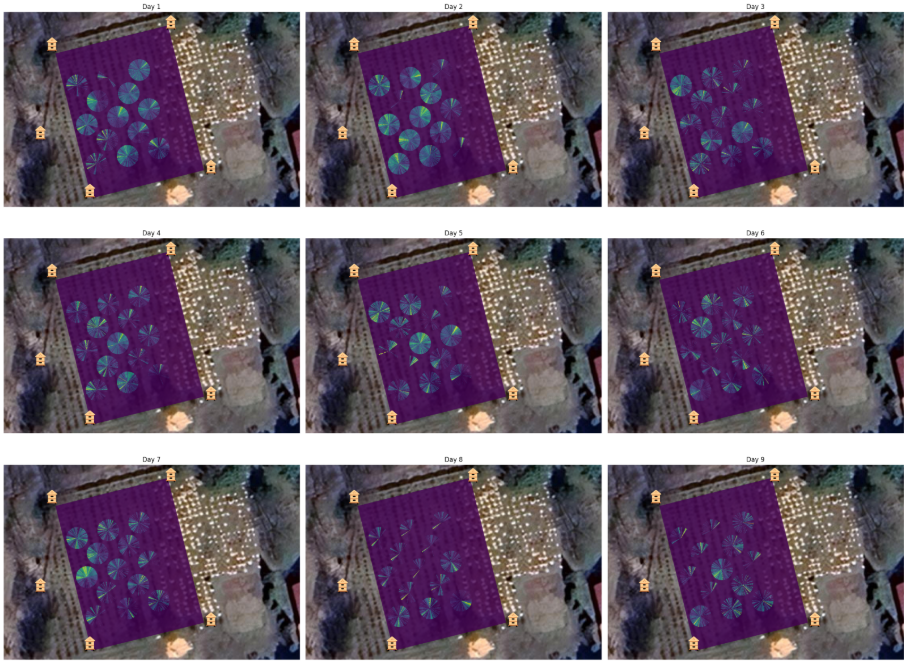
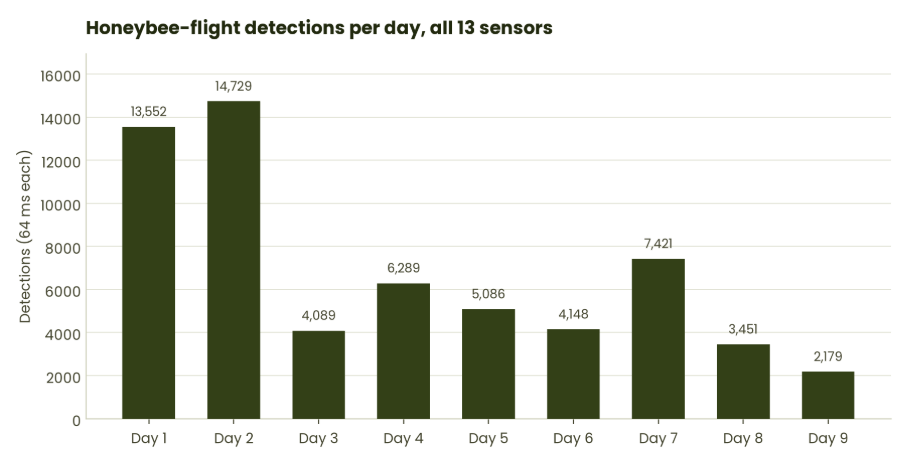
The amount of activity changed too. The sensors logged about 13,500 and 14,700 bee-flight detections on the first two days. Activity then dropped to a lower level, rose again for one day on day seven, and ended at about 2,200 detections on day nine. Most detections came between morning and afternoon. A grower could put a curve like this next to the flowering dates of their own field.
7. What a grower will get
The goal is a map of how much pollinator activity each part of a field gets, and when, during bloom, while there is still time to move hives or change a plan.
A sensor hears honeybees only within a few metres, but it does not need to hear every bee. The directions of the bees that fly past show where they come from, so one sensor tells you about a larger area than it can hear. We expect one sensor per hectare, about one every 100 metres, to be enough for a commercial farm. Commercial in-field pollination sensors run at one to four per hectare.
The dense research grid lets us test how much of this information survives as sensors are spaced further apart. Because every sensor recorded its own directional activity profile, we can remove sensors from the dataset in software and simulate sparser commercial layouts before field-scale validation in 2027.
8. Where this goes
One field, nine days, 13 sensors, and the method works. The hardware ran on a working farm, the software ran for nine days without supervision, and the direction maps show clear patterns that change with the days. BioSonar will become part of our Pollination Intelligence system. The 2027 season takes it from a test plot to real farms. To get there, the 2027 season will focus on six key improvements that connect acoustic detections more directly to real pollination activity:
- Full-size commercial plots for a full season, with sensors at farm spacing.
- Visual bee counts next to every sensor and a held-out test set, so that detection quality is measured against observation and the number of detections can be connected to real flower visits and, through them, to pollination.
- A trained classifier in place of the manual direction check.
- Counting whole flights instead of 64 ms moments.
- Separating other pollinators, such as bumblebees and hoverflies, in the same recordings.
- Logged hive and sensor coordinates, weather and bloom stage, so that each map can be tested against the conditions that produced it.
We will be back in the field in spring 2027 with the second version of BioSonar. The only open question is where. If you grow blueberries, apples, rapeseed or another crop that needs pollinators and would host a trial, or if you research pollination and want to help design the bee counts, contact us through the contact page.
Until now, a grower learned how well the bees worked only at harvest. BioSonar is built to show it during the bloom, while there is still time to act.
References
- IPBES (2016). Assessment report on pollinators, pollination and food production. https://www.ipbes.net/assessment-reports/pollinators
- Clark, Mountcastle, Mistick and Elias (2017). Resonance frequencies of honeybee wings. Journal of Experimental Biology 220:2697. https://doi.org/10.1242/jeb.154609
- Miller-Struttmann et al. (2017). Flight of the bumble bee: buzzes predict pollination services. PLOS ONE 12(6): e0179273. https://doi.org/10.1371/journal.pone.0179273
- Hearon et al. (2025). buzzdetect: deep-learning bioacoustic pollinator monitoring. Journal of Insect Science 25(6). https://pmc.ncbi.nlm.nih.gov/articles/PMC12690740/
The self-protecting hive: how honey bees fight with diseases
1. Hygienic behavior as social immunity
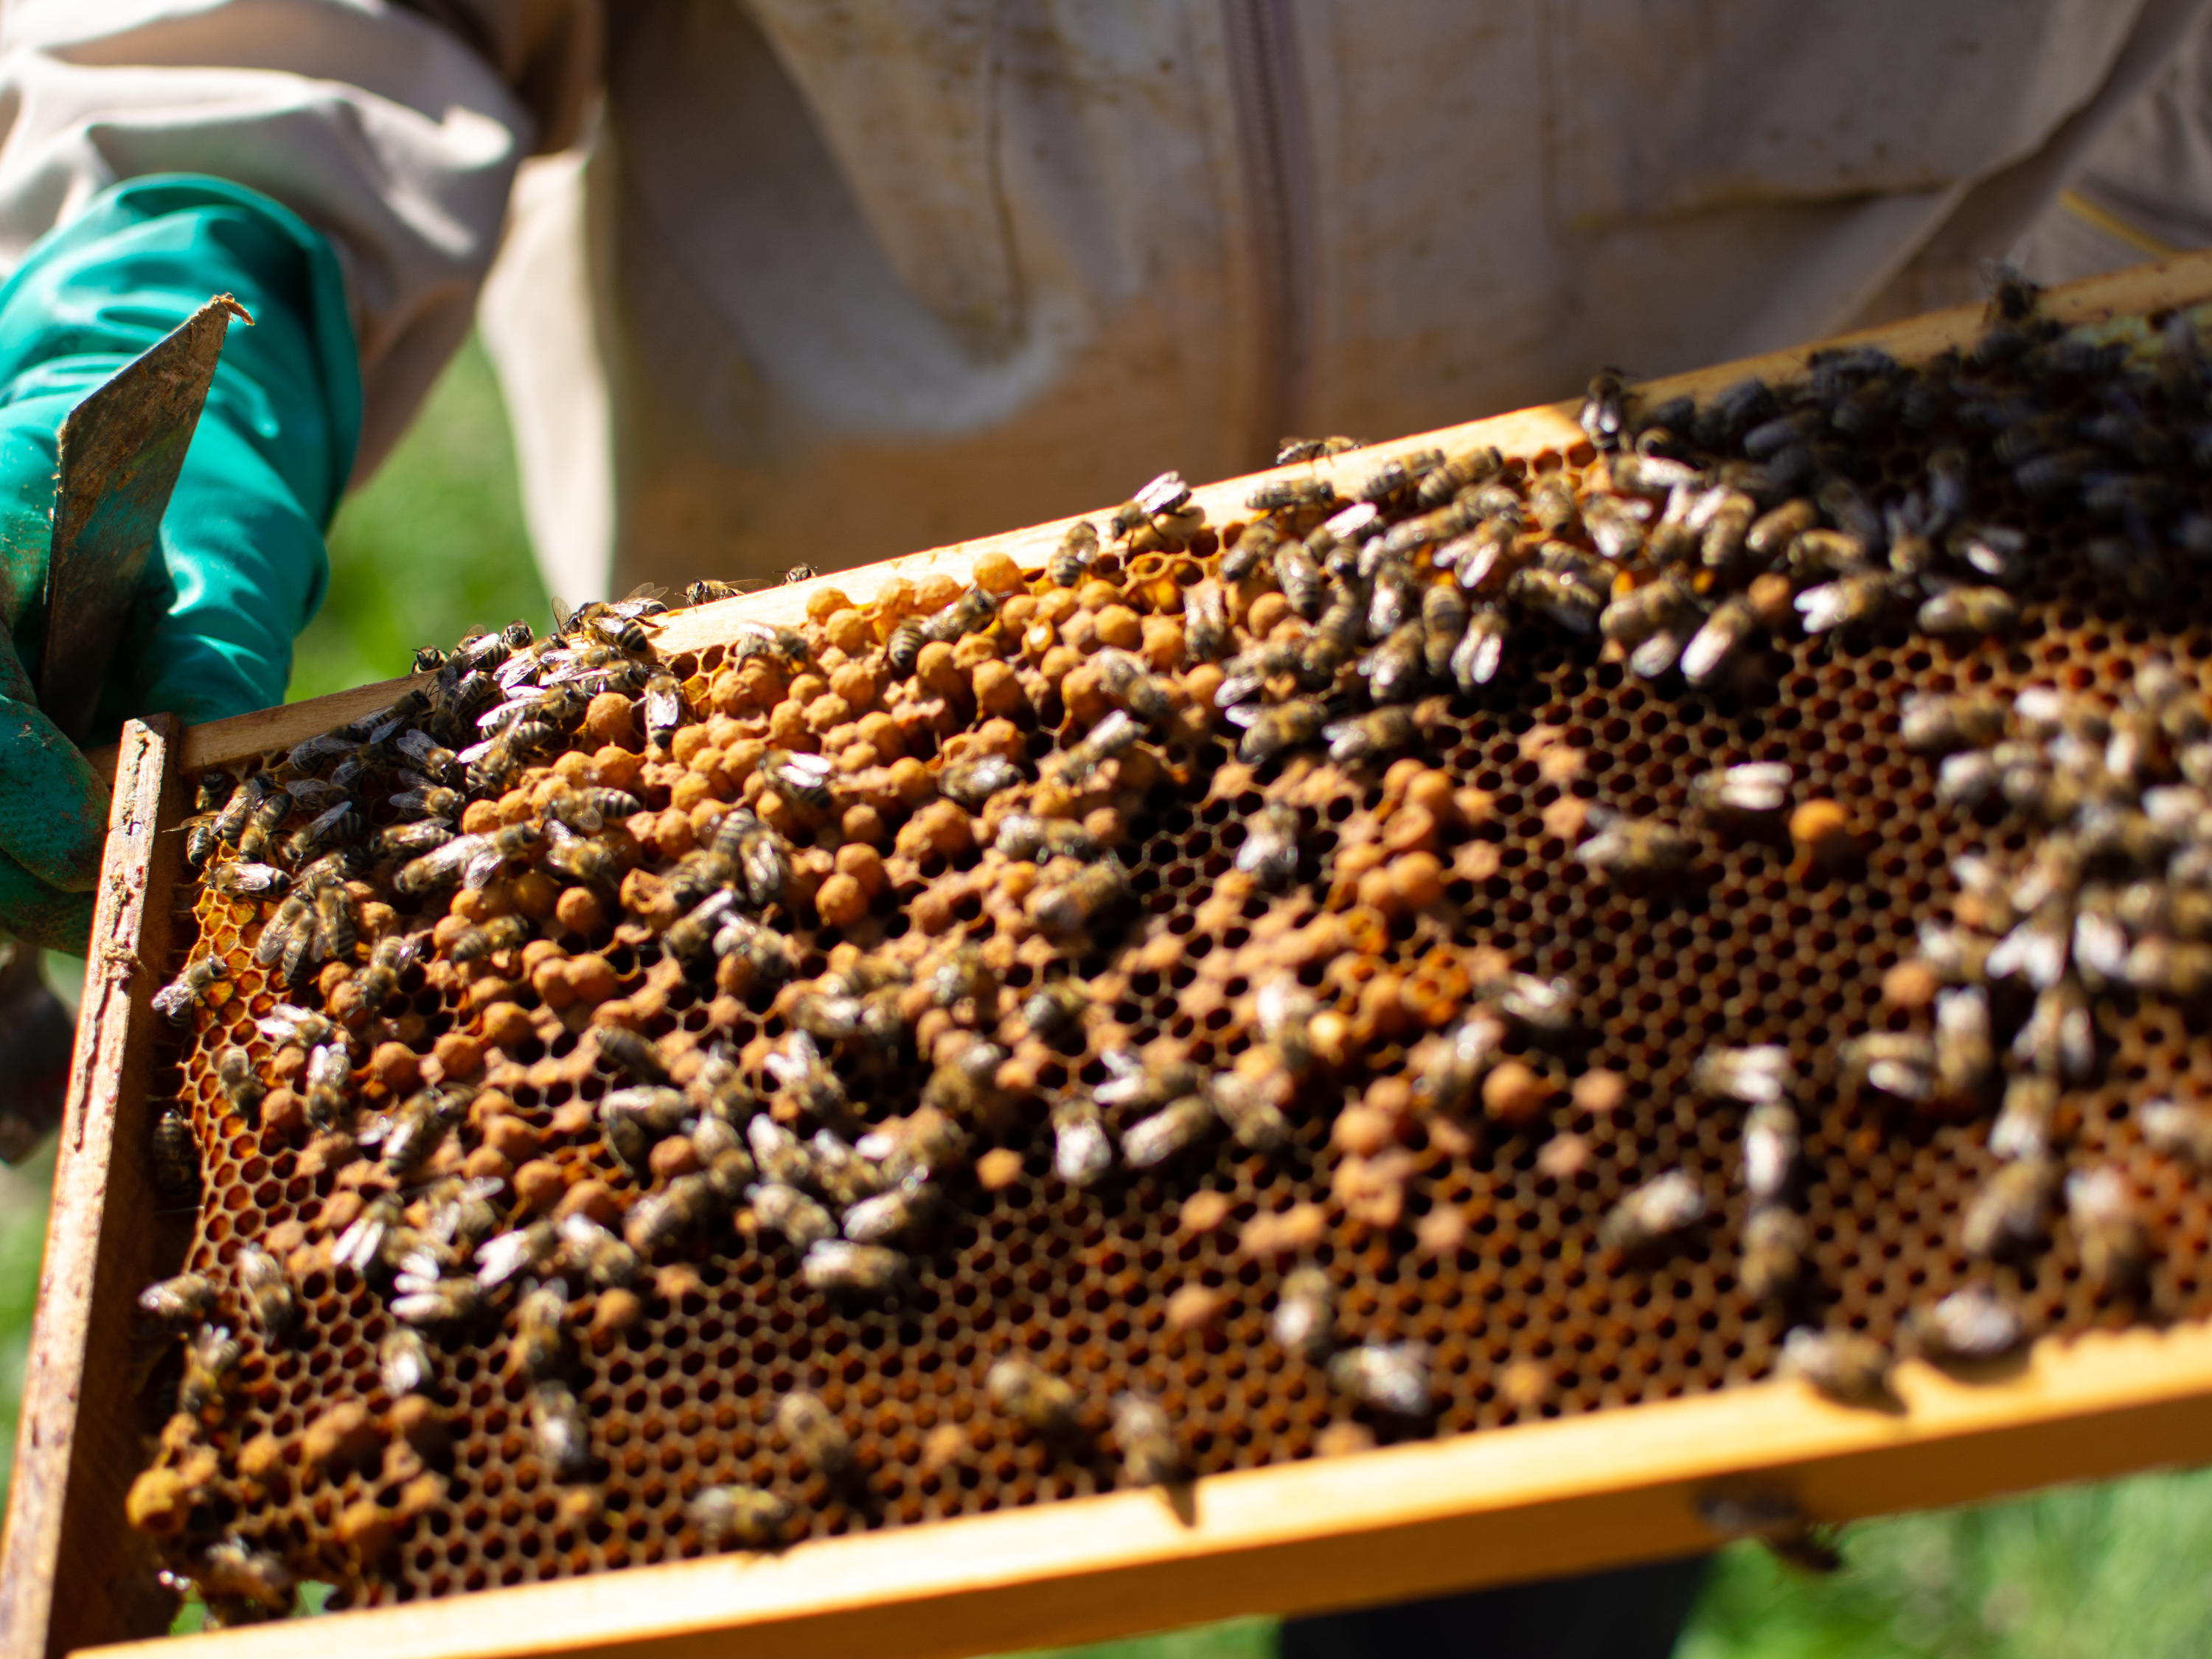
Honey bee colonies are exposed to a wide range of brood pathogens and parasites, including bacteria, fungi, mites, and viruses. Each single bee has its own (cellular and humoral) immunity, but it's not the end of their self-defense abilities. As a superorganism, honey bee colony additionally relies on collective, behavioral defenses named "social immunity" [1, 2]. The most extensively studied of these is hygienic behavior: the detection, uncapping, and removal of dead, diseased, or parasitized brood from sealed cells before the pathogen becomes infectious to the rest of the colony [3]. The phenomena was formally characterized for the first time in the 1960s, when Rothenbuhler, by using disease-killed brood, demonstrated how it was removed by bees from the hive [4].
Hygienic behavior is currently understood as one type of specific behavioral sequence (detect → uncap → remove), triggered by different chemical cues. Depending on the health status of the brood, various disease-related gases are present in the colony, which bees can detect and identify. As such situation happens for various diseases, colonies known for good hygienic response often show resistance to several unrelated threats simultaneously [3].
2. How bees "treat" the colony: detect, remove, apply medicine
A beehive is not just a passive victim of disease. It is an active, self-diagnosing, and self-treating mechanism. Of course, only to some extent – sometimes the disease develops too quickly, or the colony is too weak when the disease appears, and it needs external support. But for the strong, numerous colonies, bees have several successful strategies to deal with the pathogens.
First is always the detection of the disease. For that reason, specialized worker bees patrol the brood combs, sniff out cells containing sick or dead larvae, chew open the wax capping, and haul the corpse out of the nest – removing the infection before it can spread further. This was first documented scientifically in the 1980s, when researchers showed that bee colonies could physically resist chalkbrood fungal disease simply by removing infected larvae fast enough to stop it taking hold [5]. Later work found that this response is remarkably sensitive: bees are more likely to remove larvae killed by more dangerous, fast-acting pathogen strains than by milder ones, essentially triaging cases by severity, and they can specifically target brood cells parasitized by the most harmful strains of Varroa mite while leaving the less threatening ones alone [6]. This targeted, disease-specific version of the behavior – called Varroa Sensitive Hygiene, or VSH – is now used by breeders worldwide to raise naturally mite-resistant bee stocks [6,7]. However, the cannibalism of infested pupae, being the part of the hygienic behavior, is a double-edged sword: researchers found that partially eaten, Varroa- or virus-infected pupae can still spread DWV via nursing bees [8]. It means that hygienic removal reduces, but does not always fully eliminate, within-colony pathogen transmission. That's why active observation of your colonies is so important.
Bees forage not only for nectar and pollen but also for sticky, resinous sap from tree buds, which they carry home and use to varnish the inside of the nest: a propolis. This resin is loaded with antimicrobial plant compounds, and bees use it as… medicine. In 2021, researchers showed that bees actively apply propolis into brood cells where it interferes with the Varroa mites' reproduction, effectively functioning as a home-made pesticide, and constituting genuine "social medication" against the mite [9]. Other experiments found that when propolis is present in the nest, individual bees need to invest less energy in their own immune defenses, and are collected in greater quantities after parasite challenge, consistent with an inducible self-medicating response [10].
3. Intelligent support
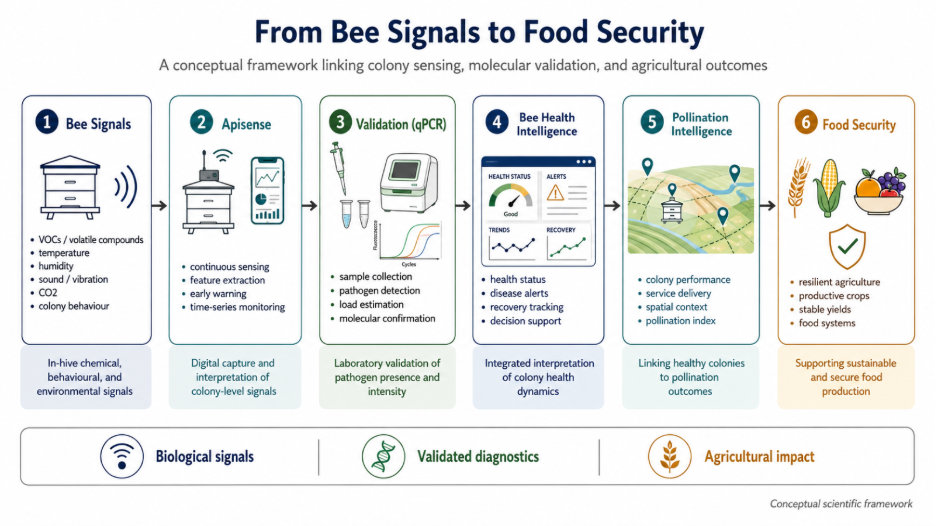
The Apisense system was designed around this biological principle. By continuously monitoring in-hive environmental parameters, including gases and volatile compounds, the system observes many of the same signals that bees themselves use to assess colony health. Rather than waiting for a beekeeper to discover symptoms during an inspection, Apisense can identify abnormal patterns associated with disease development and notify the beekeeper at a much earlier stage. In this sense, the technology acts as a digital extension of the colony's own sensory network – one signal among many inside a broader Bee Health Intelligence platform, built to track the same biological cues at the scale of entire operations, not just a single hive.
A particularly interesting example came from one of Apisense partner institutions from France, the Solu'Nature company. In May, they collected and tested samples in the laboratory, using the qPCR – one of the most sensitive molecular diagnostic methods available for detecting bee pathogens. The technique amplifies specific fragments of genetic material from the pathogen, while simultaneously measuring its amount. In practical terms, qPCR not only confirms whether a disease is present but can also estimate the level of infection, providing a quantitative measure of parasite load within the colony. The obtained laboratory results of the qPCR analysis detected Nosema and demonstrated that the colony carried an infection. Nosema disease can reduce bees’ lifespan, weakens colony performance, and increases the risk of colony loss. Because clinical signs are often subtle or absent, infections may remain unnoticed until considerable damage has already occurred. In June, the Apisense system installed in their apiary detected changes in hives consistent with a Nosema sp. infection of high level and generated an alert in the application, consistent with the previously obtained qPCR result.
During the following weeks, colonies received nutritional support and the system continued to collect in-hive data and track changes in the colonies' condition. Over time, the disease-related signal disappeared. The status shown in the Apisense application changed from a disease-warning state back to healthy, indicating that the chemical profile inside the hives had returned to normal. Such a result could have been interpreted as a false alarm, a sensor artefact, or simply random fluctuation. Instead of making assumptions, Solu'Nature team decided to verify the result and performed second qPCR analysis, using fresh samples from the same colony.
The follow-up laboratory analysis showed a significant decrease in the levels of Nosema ceranae. While level detected by qPCR in May was high, in July the test result reached level below the limit of quantification (LOQ), meaning that the colony came back to regular, healthy functioning. The molecular results agreed with the assessment generated by the Apisense system. This single case illustrates the potential of the approach; broader validation across more colonies and pathogens is ongoing. The colony had not received a specific anti-Nosema treatment during this period, except for nutritional support, yet both the sensor-based monitoring system and laboratory diagnostics indicated full recovery.
4. Why Bee Health Intelligence matters
Perhaps most importantly, the case demonstrates that in-hive sensing can capture not only the emergence of disease but also the process of recovery. The first qPCR test confirmed that Apisense correctly identified a colony challenged by Nosema. The second qPCR test confirmed that the healthy status later reported by the system reflected a genuine biological improvement rather than a system mistake. In other words, in this instance the colony's own self-treatment process appears to have been detected by the bees, reflected in the in-hive parameters, measured by Apisense, and confirmed by molecular diagnostics. The Apisense does not replace laboratory diagnostics, nor does it replace beekeeper expertise. Instead, it provides continuous observation of colony health, allowing changes to be detected, tracked, and verified over time – this is what Bee Health Intelligence looks like in practice: not a single sensor reading, but a continuous, verifiable signal of colony health.
Bee Health Intelligence enables also one additional thing: ensuring that the treatment is only used when necessary. Bees, having their own ways of dealing with pathogens and parasites, do not always need additional support from the beekeeper. By ensuring we provide it only when they really need it, we lower the costs of running the apiary and lower the risk of the development of diseases resistant to available specialized medications.
Between May and July 2026, a total of seventeen hives equipped with Apisense sensors in two Solu'Nature apiaries were monitored continuously while bee samples were sent for qPCR analysis using the PathoBee panel. Over that window, the system recorded twenty-four disease episodes, which for the first time allowed a hive-by-hive comparison between what the sensors reported and what the laboratory measured:
One of the analyzed hives, number 3, was Nosema-positive on May 3rd and disease was undetected on July 6th; the Apisense system had closed the Nosema alert nine days before the second sampling.
Hive no. 5 carried a quantifiable Nosema load in May and fell below the limit of quantification in July; its episode was flagged in the Apisense system from 17 to 30 June and ended six days before the second qPCR test.
In hive no. 7 the laboratory also moved from positive to undetected, and the system reported no Nosema at all in the time of the second test.
The direction of change measured in the laboratory and the direction of change reported by the sensors were the same. Described case shows that the reading from the system stays in line with the finest scientific methods for the colony's health assessment and, more importantly, successfully detect when the situation in the colony naturally improves again.
5. Case studies from across the globe vs. current knowledge
The obvious question is how often the same pattern shows up across all the apiaries participating in Apisense 2026 Global Field Validation Studies. Between 27 March and 28 July 2026, the Apisense platform monitored 1,757 colonies and recorded 1,874 disease episodes. We screened them according to the current knowledge and available literature and only the documented, sustained recoveries were analyzed. Peak disease severity considered was minimum at the level of moderate, and all episodes marked by beekeepers as treated against the particular disease were removed from the analysis. All episodes shorter than 7 days were additionally discarded, to make sure none of the considered cases is a simple detector noise. That resulted in 88 Varroa , 37 Nosema and 2 chalkbrood episodes for the final analysis. Each counted episode is a case when a colony showed symptoms of real disease, and which returned to health with no external treatment on record against that particular disease.
The literature specifies how long self-healing takes, depending on the type of a disease, with the reasoning behind the numbers being primarily mechanistic. In case of chalkbrood, one capped-brood cycle of about twelve days is needed, plus five to eight additional days before a mummy becomes visible [11]. Nosema has no dedicated cure: an infected bee stays infected, so a colony clears the parasite only by replacing its adult population, which in summer takes weeks [12]. For Varroa the literature gives no within-season figure at all: brood hygiene and grooming suppress mite recruitment rather than the standing mite population, phoretic mites spend 4 to 11 days on adult bees where brood hygiene cannot reach them, and even the most mite-resistant stocks only slow mite population growth instead of reducing it [7,13,14]. Where untreated colonies do stabilize, the timescale is years rather than weeks: on Gotland more than 80% of unmanaged colonies died within three years before the survivors levelled off [15], and untreated survivor colonies in Avignon persisted for a mean of 6.5 years [16]. The median time of "self-healing" by bees observed by the Apisense system are in line with the literature examples for chalkbrood (10 to 14 days) but seems to be shorter for Nosema and Varroa cases.
There might be more than one rationale for it. A qPCR, method used in the Solu'Nature apiaries, measures pathogen load at a specific time-point of collecting the bee sample, while an episode marked in Apisense system measures how long in-hive data stayed abnormal. What is more, a clinical remission is not always equivalent to full pathogen clearance: for example, in a study published in 2025, over 70% of colonies infected by the European foulbrood showed no symptoms at all [17]. The Varroa number is the useful check on all of this. Of the 1,505 detected episodes, only 11 persisted for at least 56 days; a conservative operational threshold defined a priori for the present analysis. This interval corresponds to approximately 2.5–3.5 Varroa reproductive cycles under brood-rearing conditions, rather than to a single literature-defined life cycle [13,14]. None of these episodes ended in apparent recovery, which is consistent with the expected population dynamics of the parasite.
Underneath all of the observations, there is even more basic question: when a colony can be defined as healthy at all? And when does it become diseased? The answer depends on the person you ask: a veterinarian calls a colony diseased when the signs of disease are visible, missing many of the infections being subclinical. A laboratory calls a colony diseased above a particular threshold, and the threshold depends on the context as well: in case of Varroa the classic standard is 3 mites per 300 bees and practitioner guidance uses 2% in spring and 5% in autumn [18]; for Nosema the working number is one million spores per bee [12]. And in the end, in general, a beekeeper calls a colony diseased when it stops performing well. Considering all the differences, the same colony can be healthy by one criterion and diseased by another one on the same day.
6. Strength in numbers
There is even more to think about, as every laboratory verdict comes from a single sample: 60 bees from the entrance is agreed to be enough to detect a 5% infection level with 95% probability in case of Nosema [19], and 300 bees are enough for a mite [20]. However, each such sample is taken once, at a specific moment of a season, from a colony of 20,000 to 60,000 bees, with weeks of silence between samplings. The described above French case rested on exactly two data points, nine weeks apart. Continuous in-hive sensing, on the other hand, misses the specific count of spores or mites being present in the colony. But, at the same time, it measures the environment and air inside a hive, which is the resultant of every single bee being a part of a colony and samples it every hour instead of twice a season. That is why the combination is worth more than either half on its own. And what remains a deciding factor is how many healthy bees the colony still has left to do the work.
The efficiency of hygienic behavior is influenced by the number of healthy workers carrying them out, meaning: the colony size. In 2024, scientists found that hygienic performance increases with the number of workers available, though this effect levels off once a colony reaches a normal, healthy population size. It means that a strong, populous hive isn't necessarily "more hygienic" than an average one – but a weak, dwindling colony can lose the workforce needed to keep up with disease removal, grooming and resin-collecting all at once. Additional colony strength does not further improve the removal rate, so the beekeepers can compare hygienic performance across colonies of normal size without controlling population differences [21]. It also explains why colony strength remains one of the best overall predictors of colony health: field studies from Ecuador and other world regions combined high-hygienic colonies with lower Varroa infestation and simultaneously maintained or improved honey yield [22].
6. Can bees actually treat themselves?
It's worth being honest about the limits of this self-treatment system. None of such behaviors make a colony invincible: the same 2025 chalkbrood study found that VSH bees still developed disease when deliberately and heavily exposed – they were simply more resistant, not immune [23]. Even partially eaten, infected pupae can spread virus through the nurse bees tasked with cleaning them up [8], so even hygienic removal carries some risk. The honest picture, then, is not of a hive with a magic cure, but of a colony running several imperfect, overlapping treatments, and with the care of conscious and aware beekeeper, knowing and understanding when and what kind of support their bees need. For that reason, an additional support of Apisense system is so important in the process and it provides a glimpse into the future of precision beekeeping: a future in which the hive continuously communicates its health status, the beekeeper receives timely and objective information to undertake more informative decisions and additionally ensures the beekeeper that nothing was overlooked while taking care of their colonies. This convergence of biology, sensing technology, laboratory validation, and management decisions can be supported by both natural colony intelligence and advanced monitoring systems.
Bees diagnose, treat, and recover on their own – they have for millions of years, long before any technology existed. Our role at Apisense isn't to replace that biology - it's to understand it: to translate the signals a colony is already generating, into data a beekeeper, a scientist, and a farmer can trust. Every colony is already producing biological data. The challenge is no longer collecting it, but transforming it into intelligence that can support beekeepers, scientists, farmers, and ultimately global food security. This case from France is a single, illustrative example, but it points to something larger – a future in which colony health, and eventually pollination itself, can be measured, verified, and protected at the scale food security demands.
References
[1] Morfin, N., Anguiano-baez, R., Guzman-Novoa, E. Honey bee (Apis mellifera) immunity. Veterinary Clinics: Food Animal Practice, 37(3) 521-533 (2021). https://doi.org/10.1016/j.cvfa.2021.06.007
[2] Cremer, S., Armitage, S.A.O., Schmid-Hempel, P. Social immunity. Curr. Biol. 17(16), R693–R702 (2007). https://doi.org/10.1016/j.cub.2007.06.008
[3] Spivak, M., Danka, R.G. Perspectives on hygienic behavior in Apis mellifera and other social insects. Apidologie 52, 1–16 (2021). https://link.springer.com/article/10.1007/s13592-020-00784-z
[4] Rothenbuhler, W.C. Behavior genetics of nest cleaning in honey bees. IV. Responses of F1 and backcross generations to disease-killed brood. Am. Zool. 4(2), 111–123 (1964). https://academic.oup.com/icb/article/4/2/111/2001725
[5] Gilliam, M., Taber, S., Richardson, G.V. Hygienic behavior of honey bees in relation to chalkbrood disease. Apidologie 14(1), 29–39 (1983). https://www.apidologie.org/articles/apido/pdf/1983/01/Apidologie_0044-8435_1983_14_1_ART0003.pdf
[6] Mondet, F. et al. Specific cues associated with honey bee social defence against Varroa destructor infested brood. Sci. Rep. 6, 25444 (2016). https://www.ncbi.nlm.nih.gov/pmc/articles/PMC4853723/
[7] Harbo, J.R., Harris, J.W. Suppressed mite reproduction explained by the behaviour of adult bees. J. Apic. Res. 44(1), 21–23 (2005). https://doi.org/10.1080/00218839.2005.11101141
[8] Posada-Florez, F. et al. Pupal cannibalism by worker honey bees contributes to the spread of deformed wing virus. Sci. Rep. 11, 8989 (2021). https://doi.org/10.1038/s41598-021-88649-y
[9] Pusceddu, M. et al. Honeybees use propolis as a natural pesticide against their major ectoparasite. Proc. R. Soc. B 288, 20212101 (2021). https://pmc.ncbi.nlm.nih.gov/articles/PMC8670950/
[10] Borba, R.S. et al. Propolis consumption ramps up the immune response in honey bees infected with bacteria. Apidologie (2017). https://link.springer.com/article/10.1007/s13592-017-0553-z
[11] Aronstein, Katherine, and Beth Holloway. Honey bee fungal pathogen, Ascosphaera apis; current understanding of host-pathogen interactions and host mechanisms of resistance. Microbial pathogens and strategies for combating them: science, technology and education. Spain: Formatex Research Centre (2013): 402-410.
[12] Emsen, B. et al. Seasonality of Nosema ceranae Infections and Their Relationship with Honey Bee Populations, Food Stores, and Survivorship in a North American Region. Vet. Sci. 7(3), 131 (2020). https://www.mdpi.com/2306-7381/7/3/131
[13] Rosenkranz, P., Aumeier, P., Ziegelmann, B. Biology and control of Varroa destructor. J. Invertebr. Pathol. 103, S96–S119 (2010). https://doi.org/10.1016/j.jip.2009.07.016
[14] Martin, S.J. A population model for the ectoparasitic mite Varroa jacobsoni in honey bee (Apis mellifera) colonies. Ecol. Modell. 109(3), 267–281 (1998). https://doi.org/10.1016/S0304-3800(98)00059-3
[15] Fries, I., Imdorf, A., Rosenkranz, P. Survival of mite infested (Varroa destructor) honey bee (Apis mellifera) colonies in a Nordic climate. Apidologie 37(5), 564–570 (2006). https://doi.org/10.1051/apido:2006031
[16] Le Conte, Y. et al. Honey bee colonies that have survived Varroa destructor. Apidologie 38(6), 566–572 (2007). https://doi.org/10.1051/apido:2007040
[17] Fowler PD, Dhakal U, Chang JH, Milbrath MO (2025) Everything, everywhere, all at once - Surveillance and molecular epidemiology reveal Melissococcus plutonius is endemic among Michigan, US beekeeping operations. PLOS ONE 20(9): e0331903. https://doi.org/10.1371/journal.pone.0331903
[18] K. Olszewski, Biotechniczne Zwalczanie Warrozy: Współczesne Możliwości „archaicznych” Metod (Wydawnictwo BEE & HONEY, Klecza Dolna, 2025).
[19] Pirk, C.W.W. et al. Statistical guidelines for Apis mellifera research. In: Dietemann, V., Ellis, J.D., Neumann, P. (eds) The COLOSS BEEBOOK, Volume I: standard methods for Apis mellifera research. J. Apic. Res. 52(4) (2013). https://doi.org/10.3896/IBRA.1.52.4.13
[20] Mukogawa, B., Nieh, J.C. The Varroa paradox: infestation levels and hygienic behavior in feral scutellata-hybrid and managed Apis mellifera ligustica honey bees. Sci Rep 14, 1148 (2024). https://doi.org/10.1038/s41598-023-51071-7
[21] Snyder, P., Martin, J., Herman, J.J. et al. The impact of honey bee (Apis mellifera) group size on hygienic behavior performance. Behav. Ecol. Sociobiol. 78, 52 (2024). https://link.springer.com/article/10.1007/s00265-024-03471-6
[22] Hygienic Behavior of Apis mellifera and Its Relationship with Varroa destructor Infestation and Honey Production in the Central Highlands of Ecuador. (2021). https://pmc.ncbi.nlm.nih.gov/articles/PMC8619998/
[23] Honey bees bred for Varroa sensitive hygiene trait demonstrate resistance to chalkbrood disease. PLOS ONE (2025). https://journals.plos.org/plosone/article?id=10.1371/journal.pone.0329739